|
|
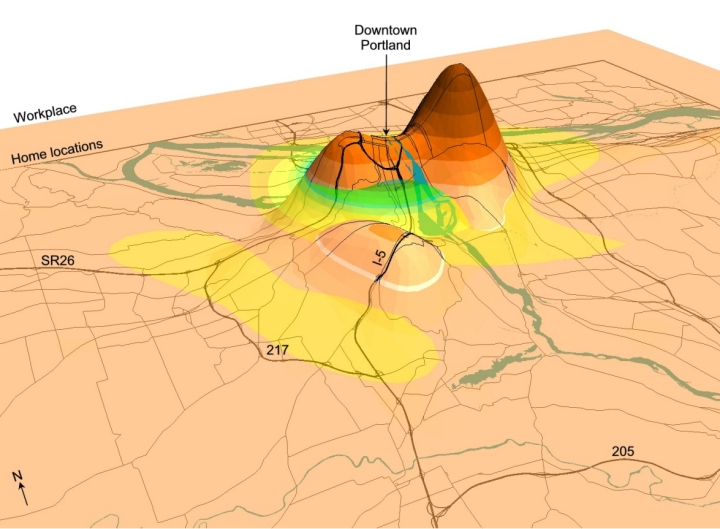
Using an activity-travel diary dataset collected in Portland, Oregon (which logged a total of 128,188 activities of 10,084 individuals), the density surfaces of the home and employment locations of a subsample of individuals are generated and overlaid in this figure. The peaks of the home location surface (bottom) pass through the transparent workplace density surface (top) from below, highlighting the spatial relationships between the peaks of the surfaces. |
|
|
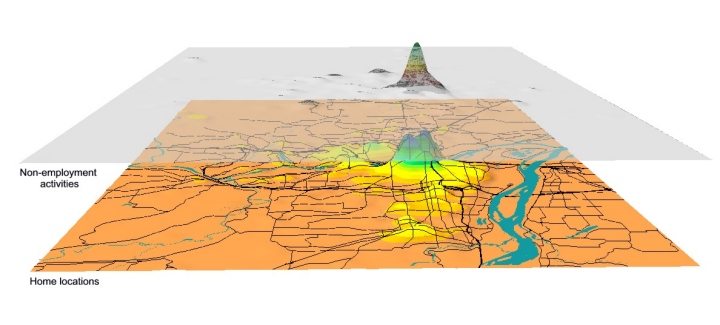
Using the same Portland (Oregon) dataset, the density surface of non-employment activities
is displayed transparently on top of the density surface of home locations of the
selected individuals. The
figure, oriented towards west, shows that the major peak of non-employment
activities is centered at downtown Portland within the “loop”, and there
are also considerable concentrations northeast of downtown and around
Beaverton.
|
|
|
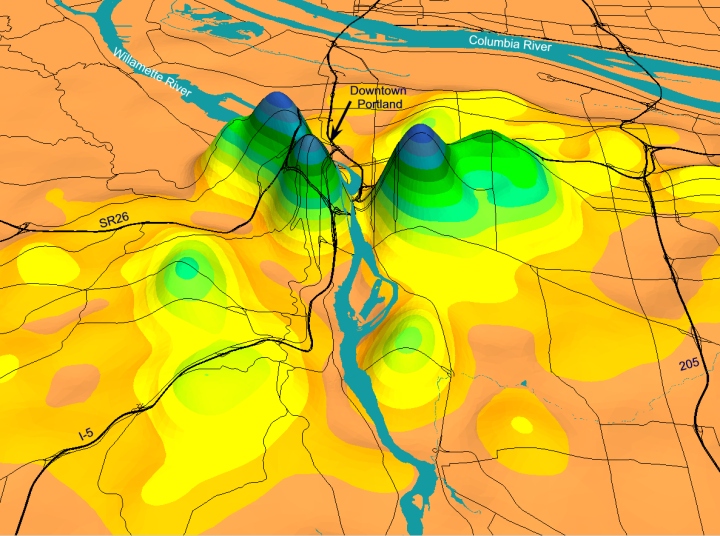
A a close-up view of the same 3D scene in which the transparent density surface
of non-employment activities is not shown. Three distinctive peaks of home
locations can be clearly seen in this figure. They are located at downtown
Portland inside the “loop”, in areas northwest and east of downtown
Portland.
Other areas with high concentration of home locations are found in Beaverton
and in the area north of Milwaukee. The major advantage of this
visualization method is its capability for examining the spatial
relationships between different surfaces in their concrete geographical
context.
|
|
|
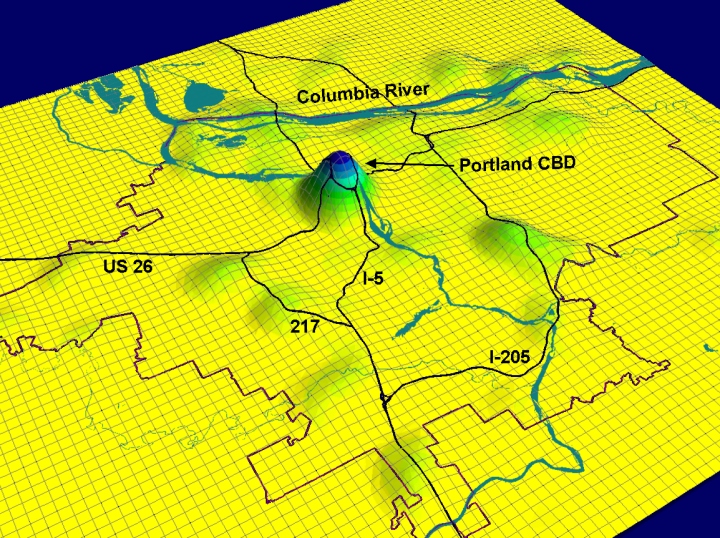
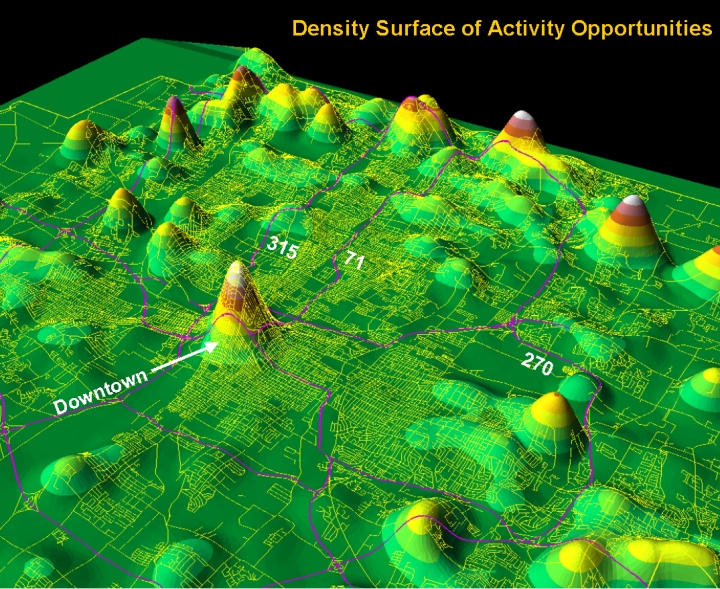
Weighted area of 27,749 commercial parcels in Portland, Oregon, was used to generate this opportunity density surface. |
|
|
Weighted area of 10,727 commercial parcels in Columbus, Ohio, was used to generate this opportunity density surface. |