|
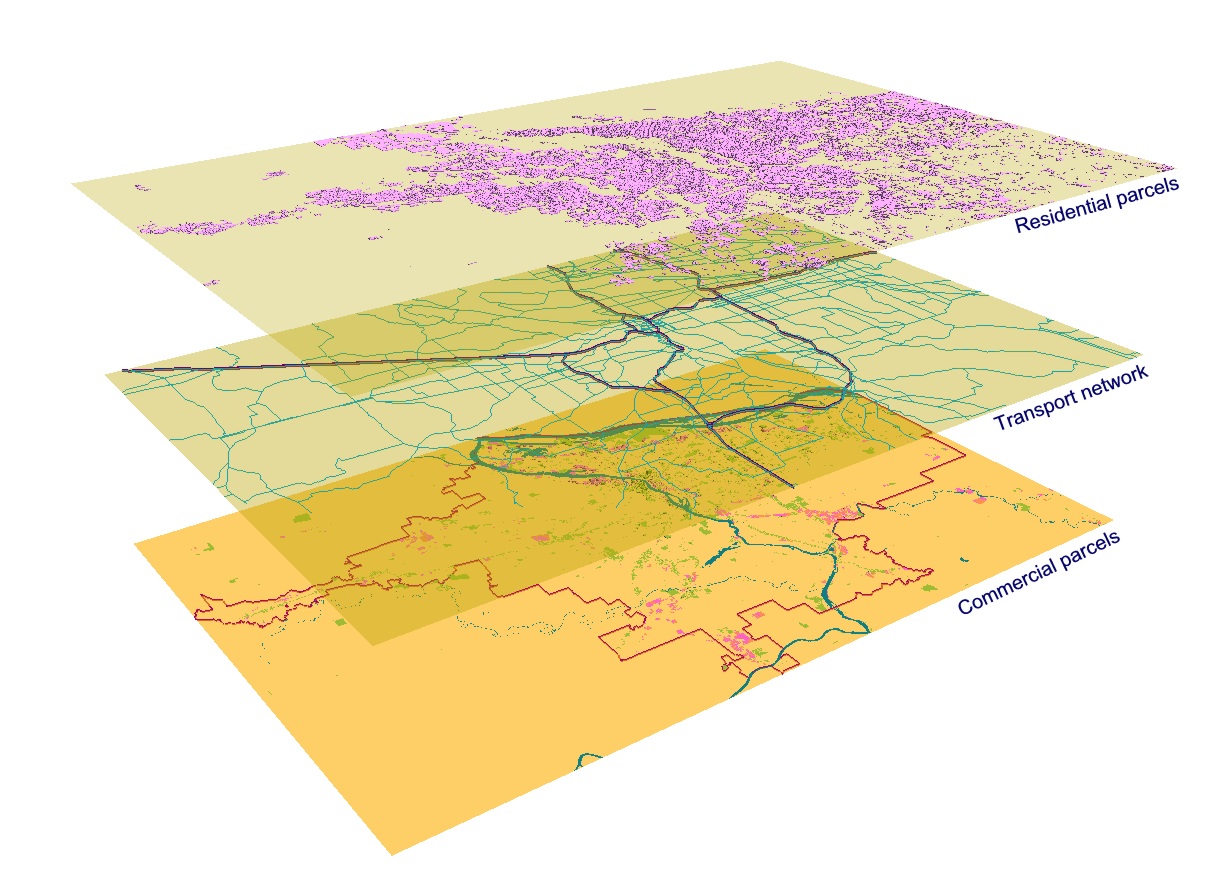
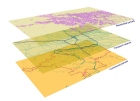
Figure 1: Three layers of geographical data used in the study.
|
|
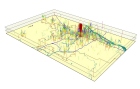
Figure 2: Simple activity patterns in space-time.
|
|
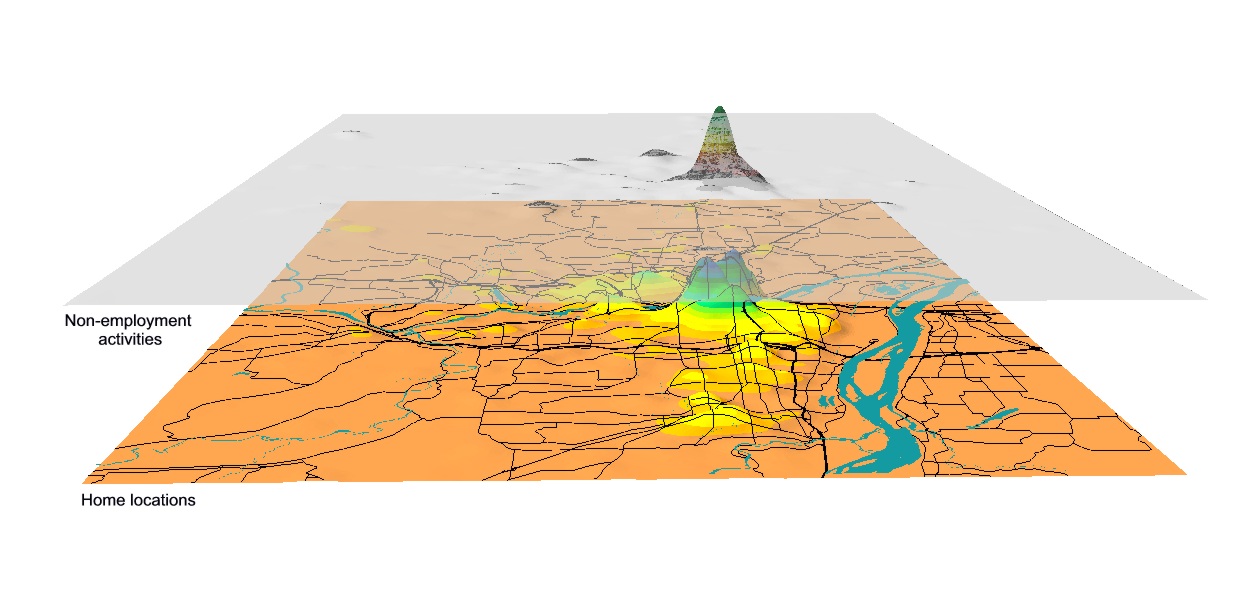
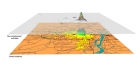
Figure 3: Activity density patterns in geographic space.
|

|
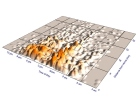
Figure 4: A close-up view of the density surface of home locations of the selected individuals.
|
|
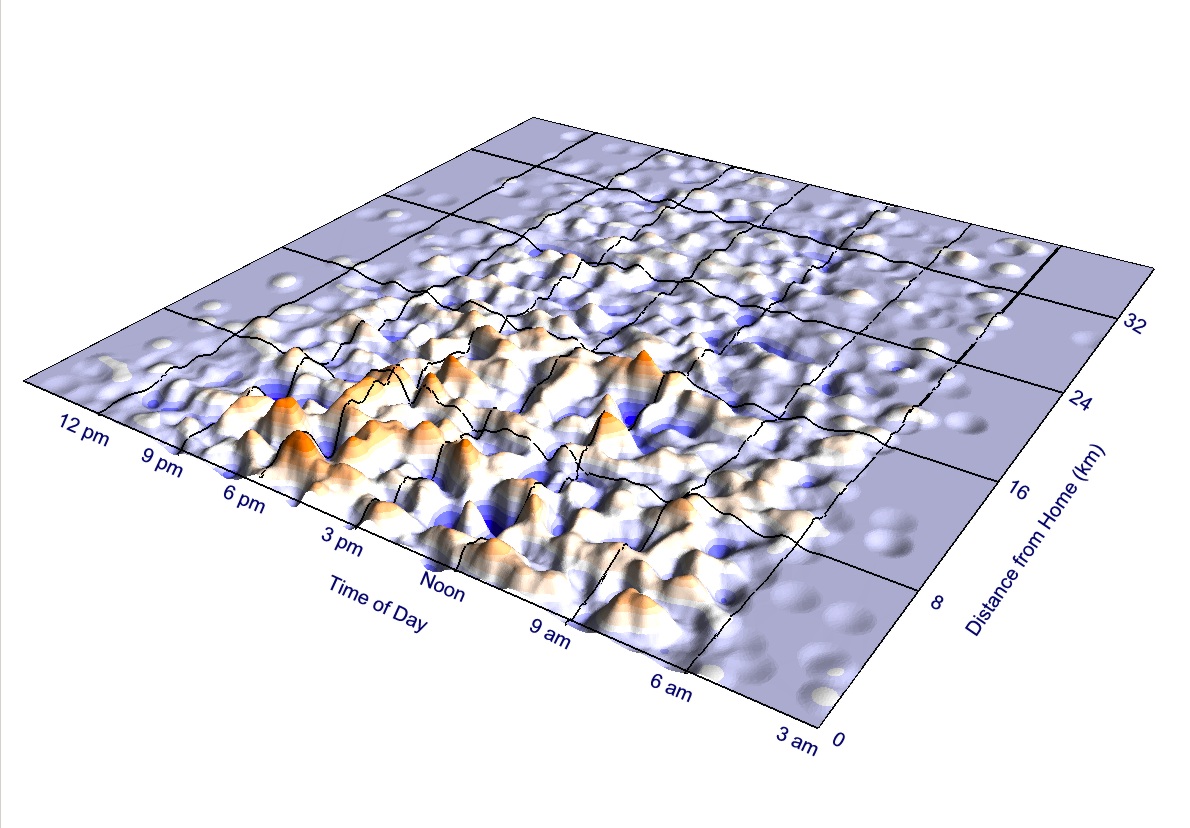
Figure 5: Space-time activity density of the non-employment activities of
the full-time employed women in the sample.
|

|
Figure 6: Gender difference in the space-time density of non-employment
activities between the full-time employed women and men in the sample.
|
|
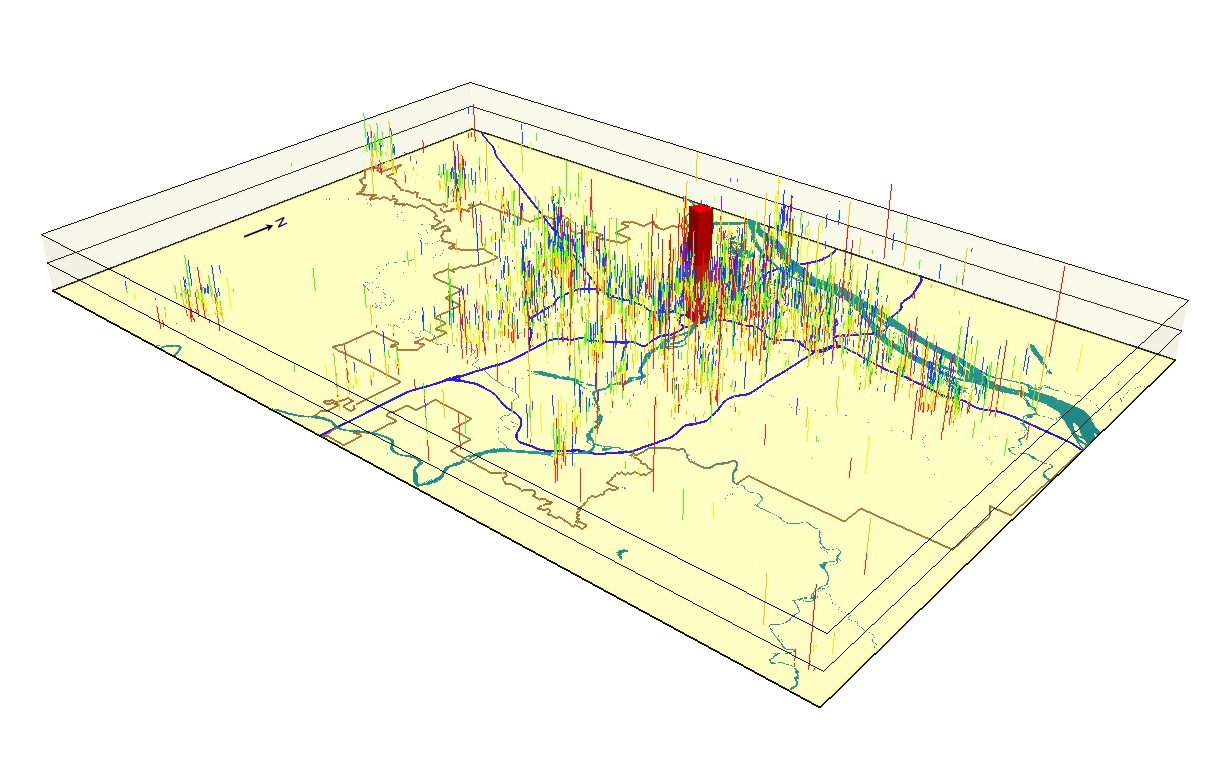
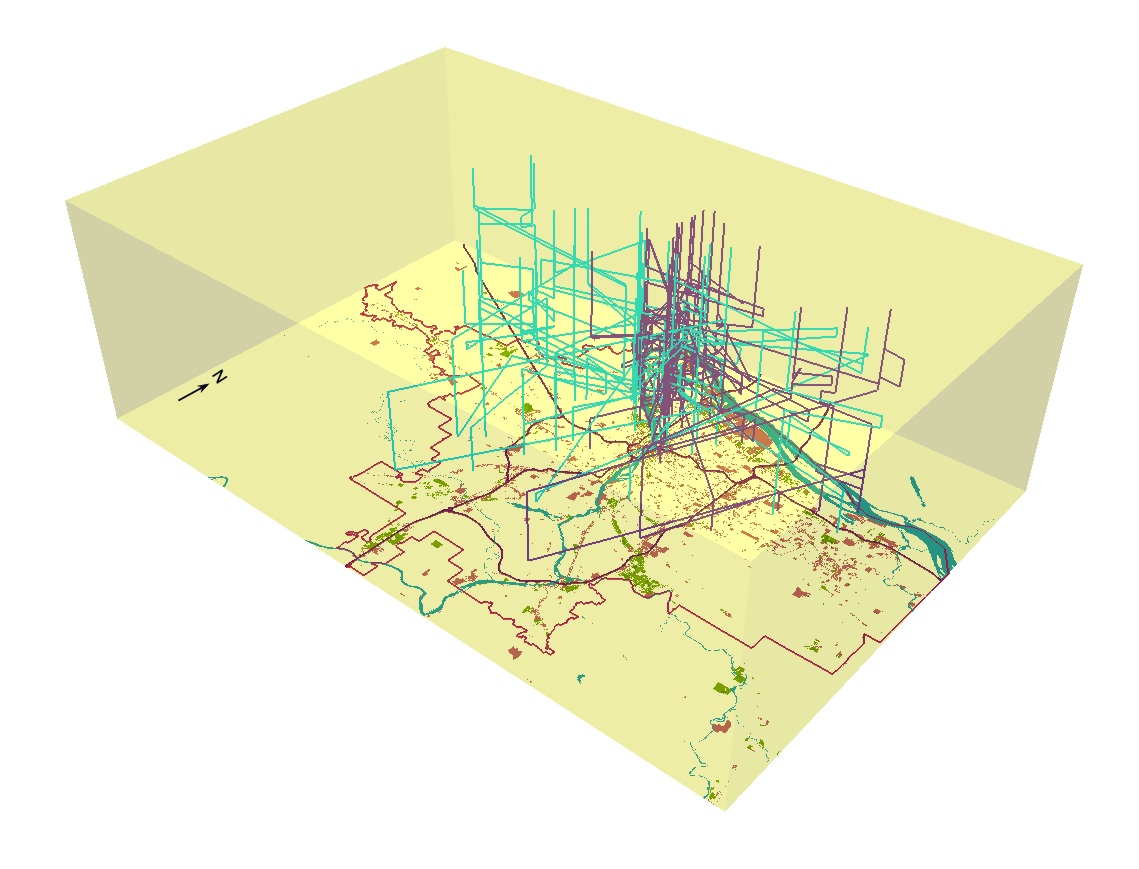
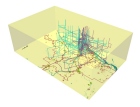
Figure 7: Space-time aquarium showing the space-time paths of African and
Asian Americans in the sample.
|

|
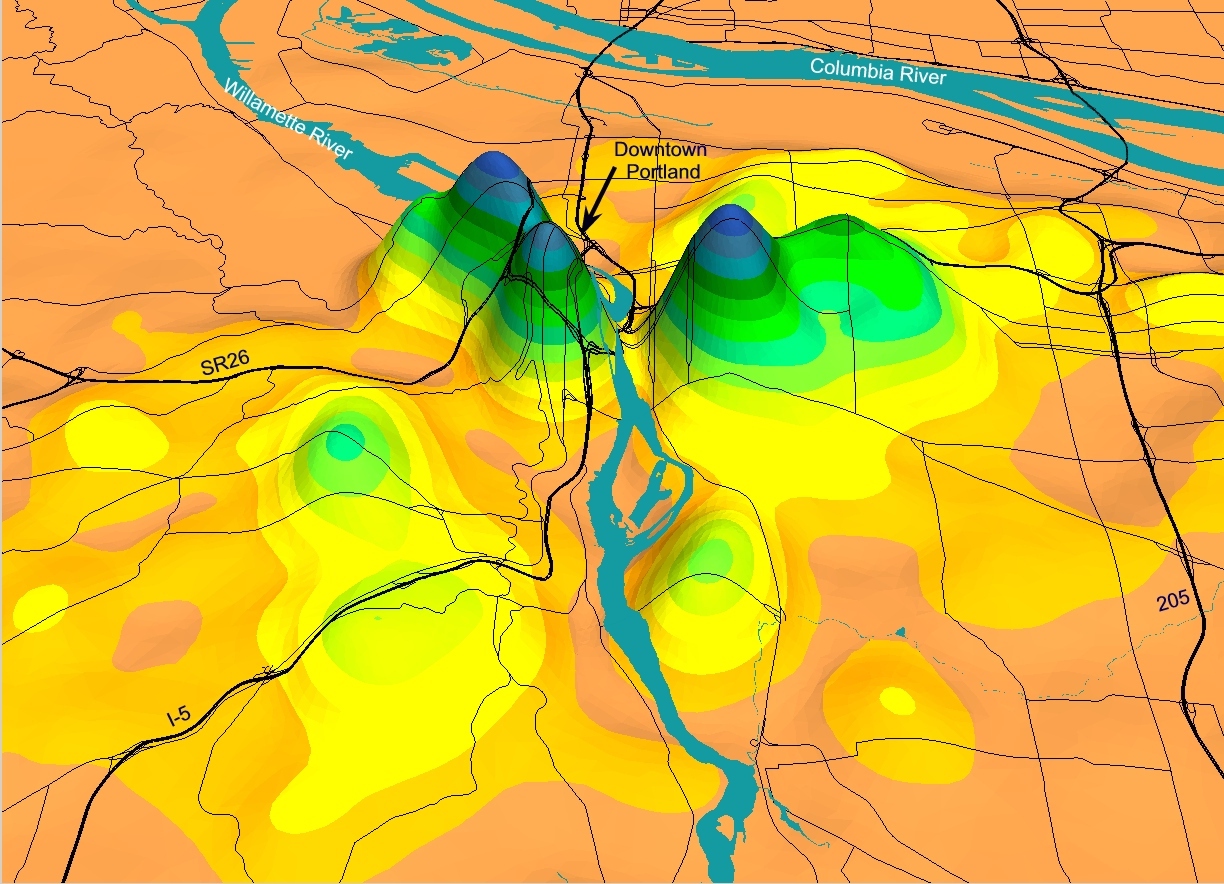
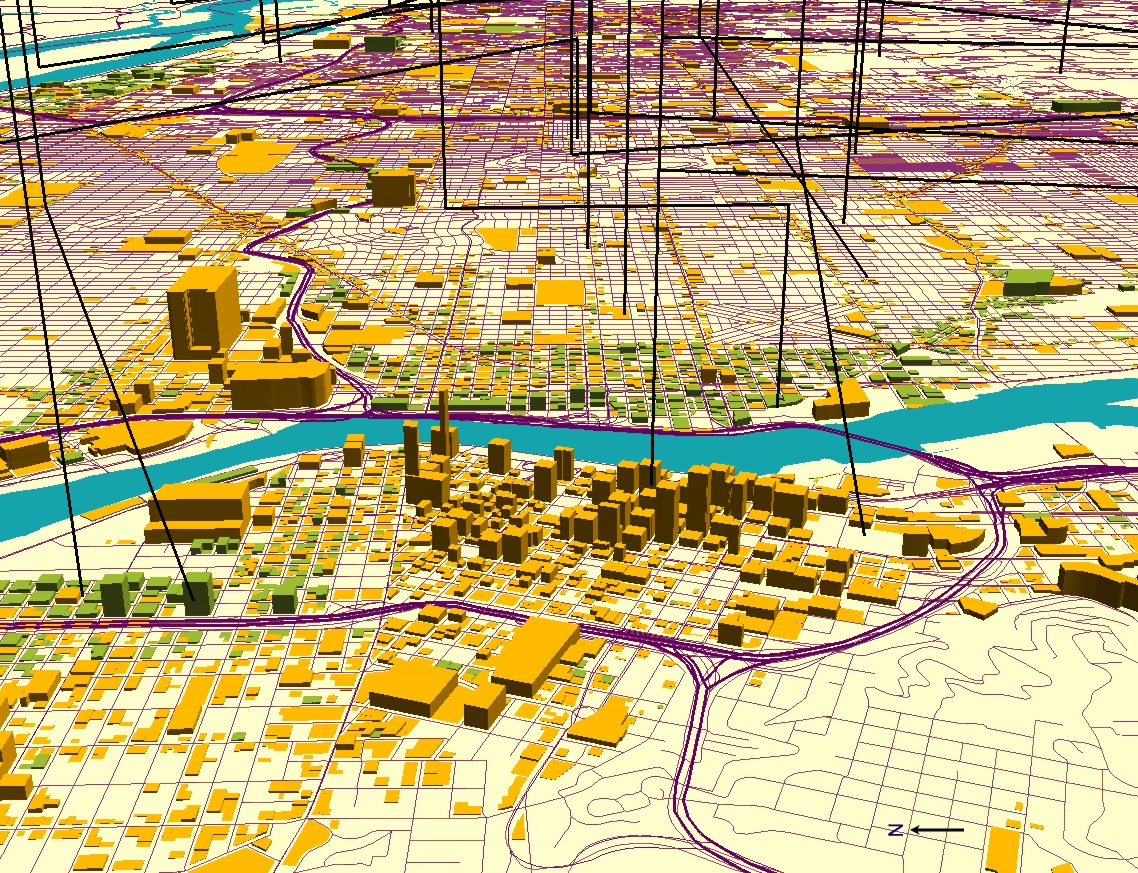
Figure 8: A close-up view of downtown Portland.
|
|
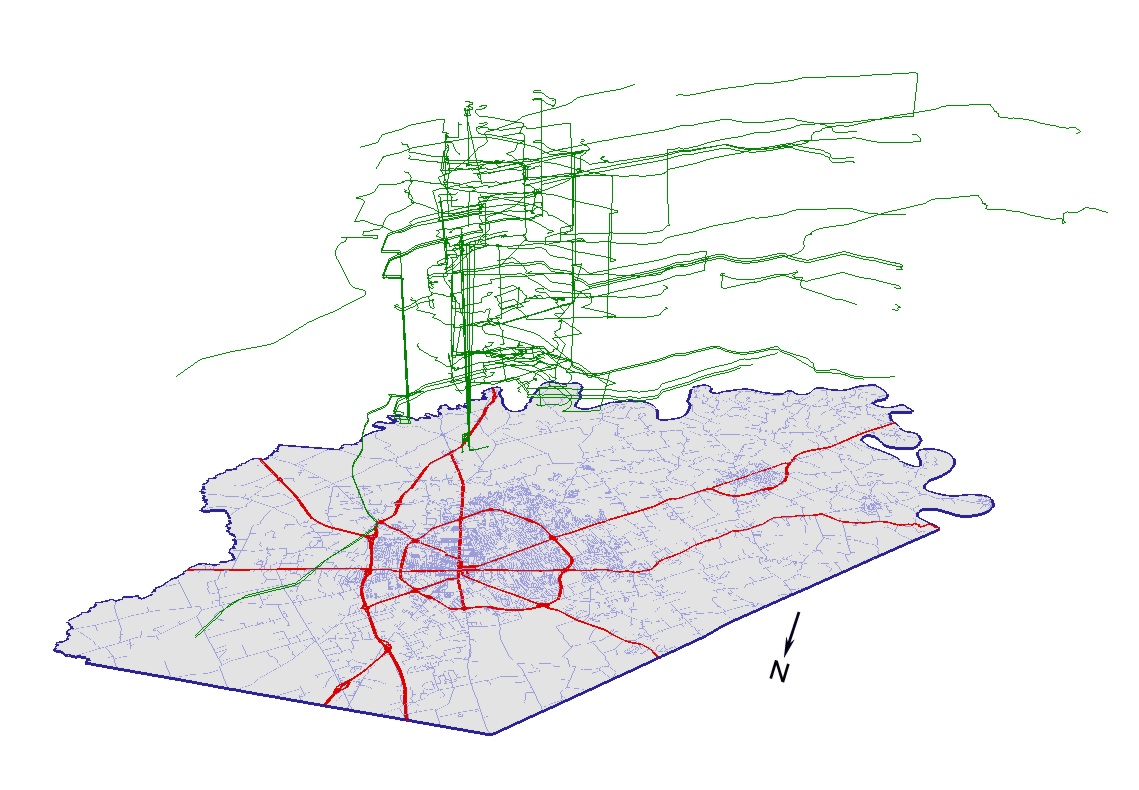
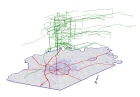
Figure 9: Space-time paths based on GPS data collected in Lexington, Kentucky.
|