Links To The Color Figures
In Mei-Po Kwan's Recent Publications
Click "Link Page" for individual link pages with thumbnails.
Kwan's Homepage
Mei-Po Kwan and Guoxiang Ding (2008)
Geo-Narrative: Extending geographic information systems for narrative analysis in
qualitative and mixed-method research. The Professional Geographer, 60(4): 443-465.
[Link Page]
- Figure 1:
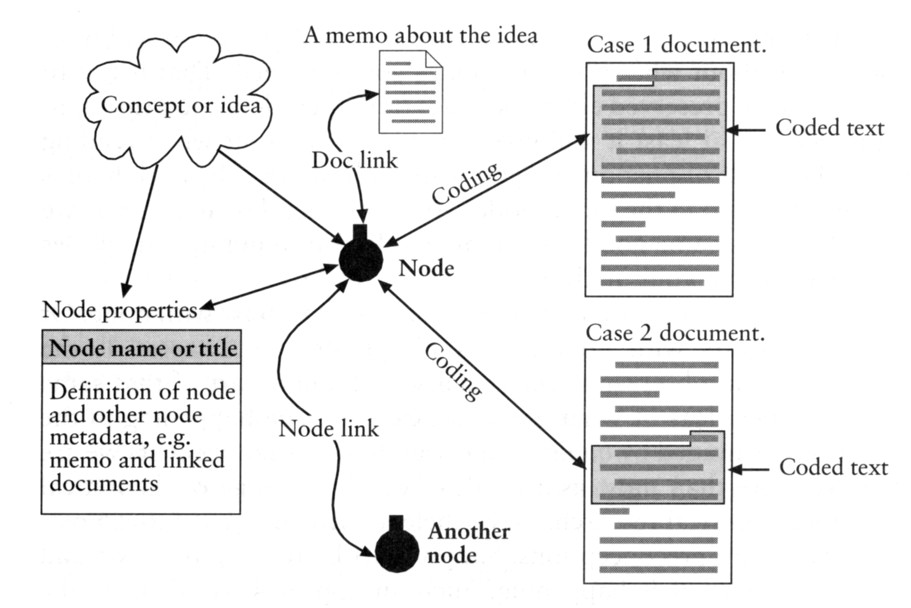
Figure 1: Relationships among a node, coded text,
and documents in NVivo (Source: Gibbs 2002. Used
by permission of Graham R. Gibbs).
- Figure 2:
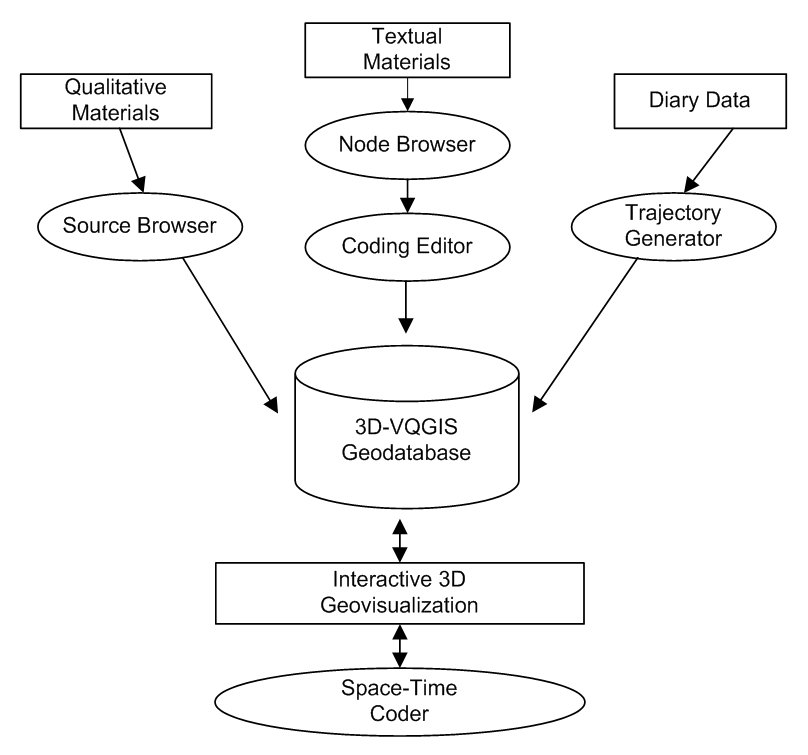
Architecture of 3D-VQGIS.
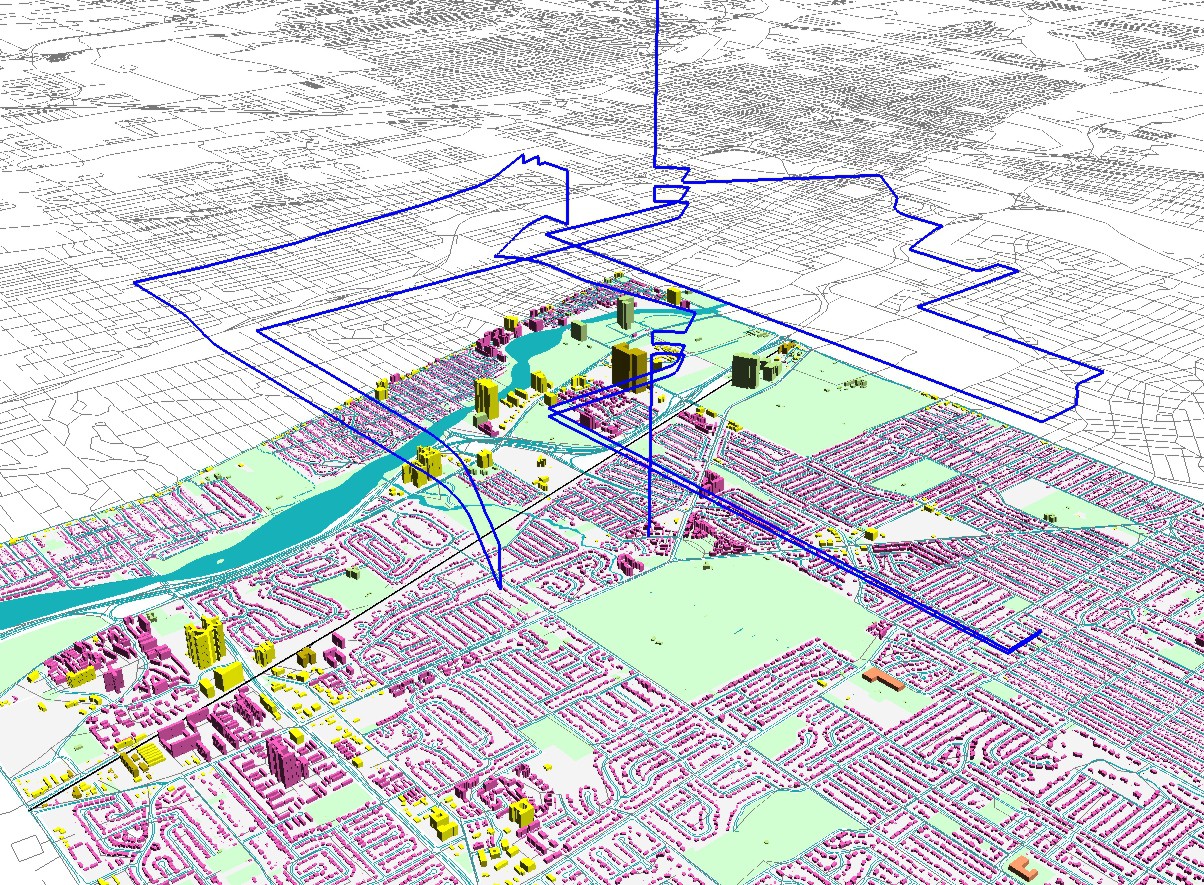
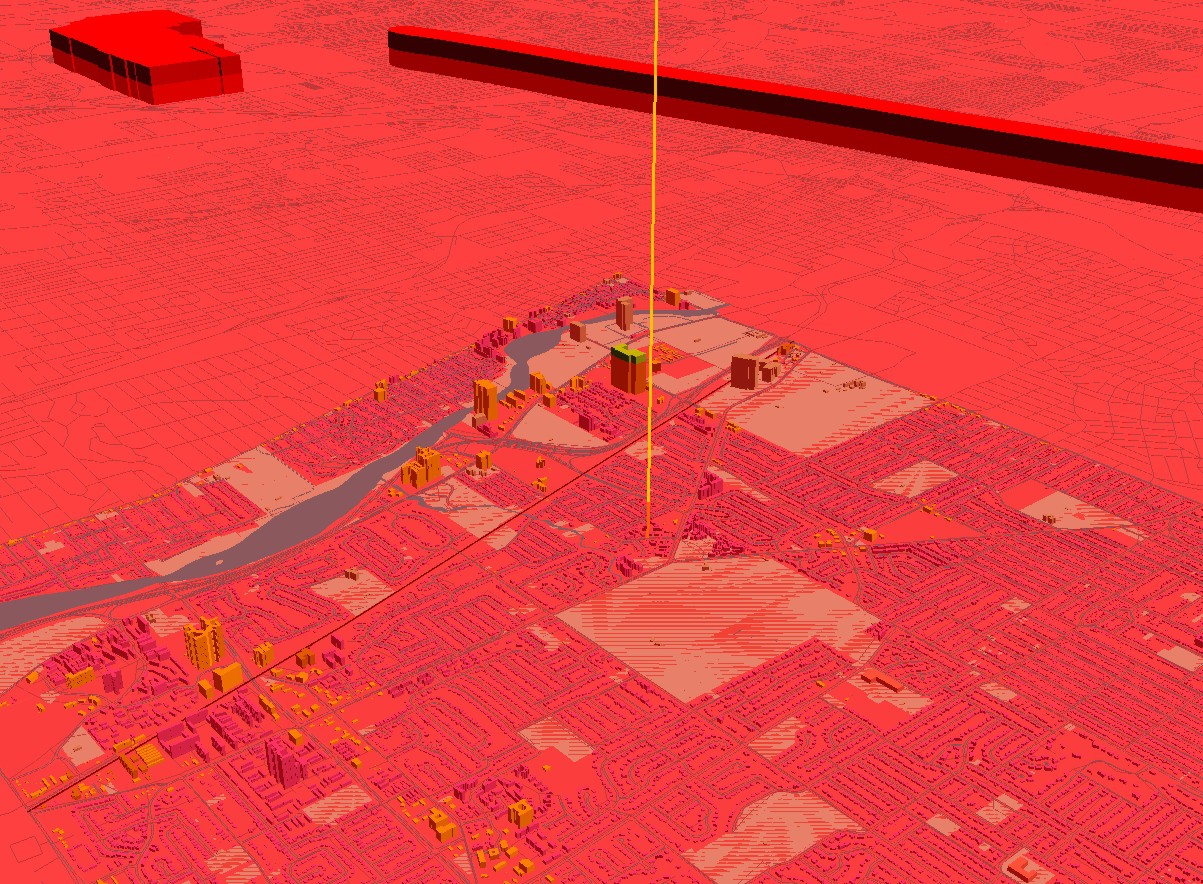
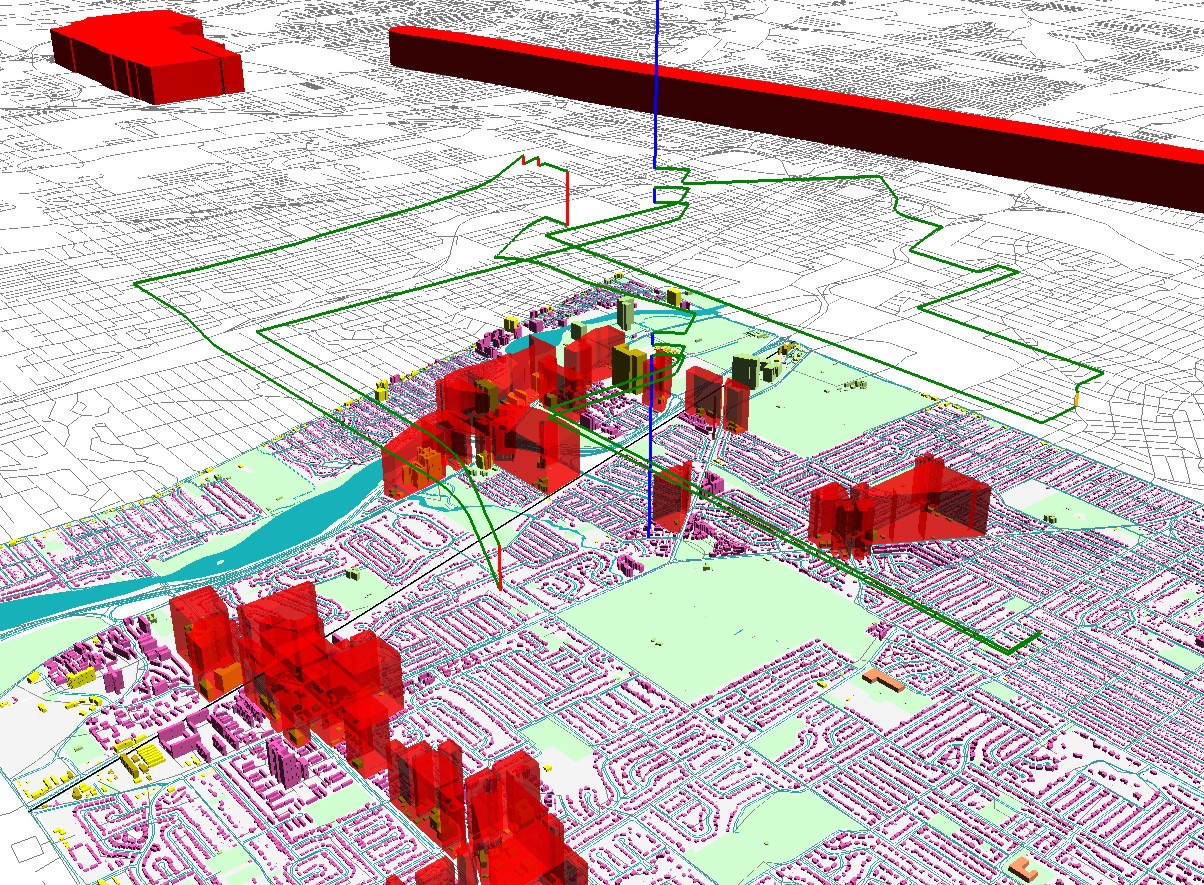
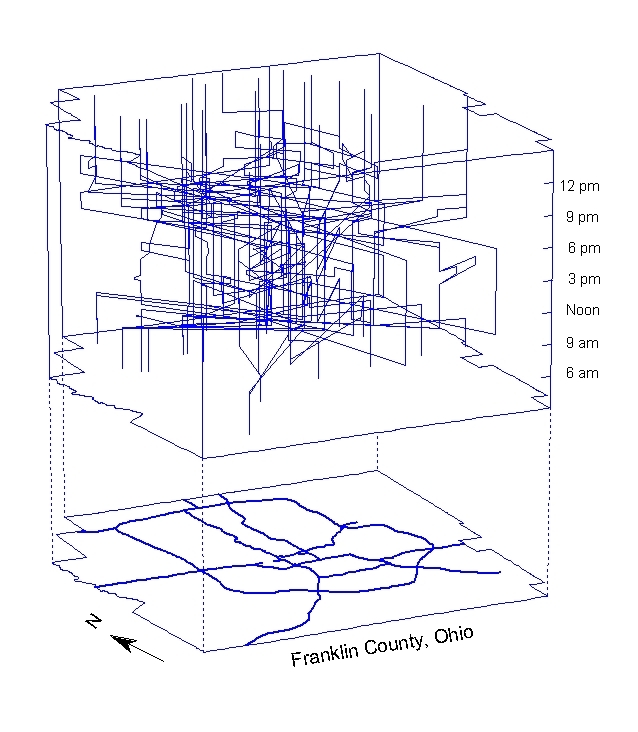
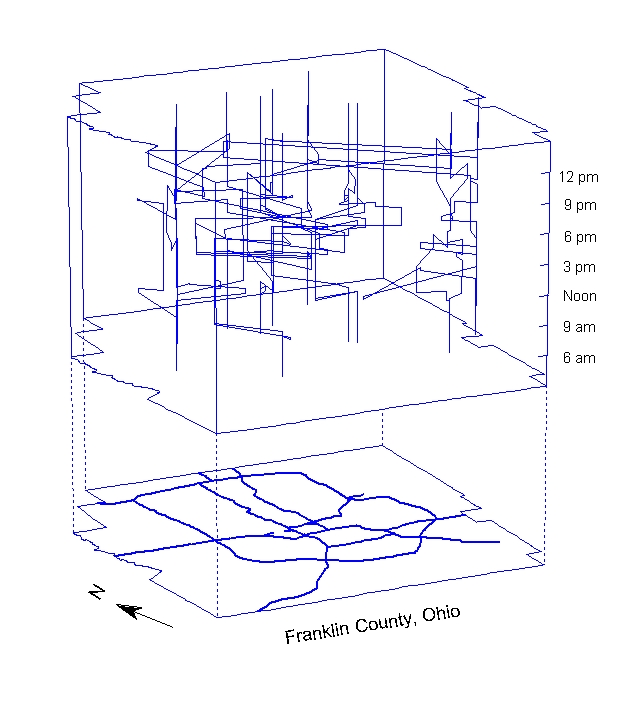
- Figure 3:
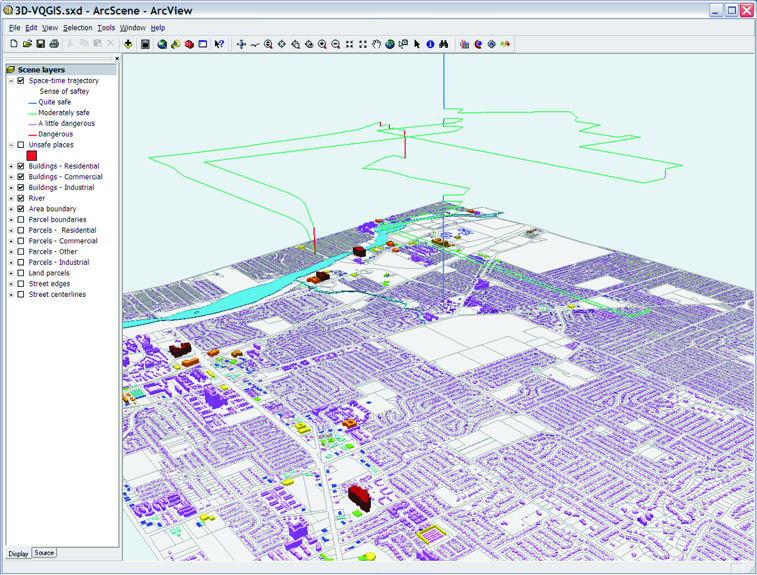
Life path of the selected participant.
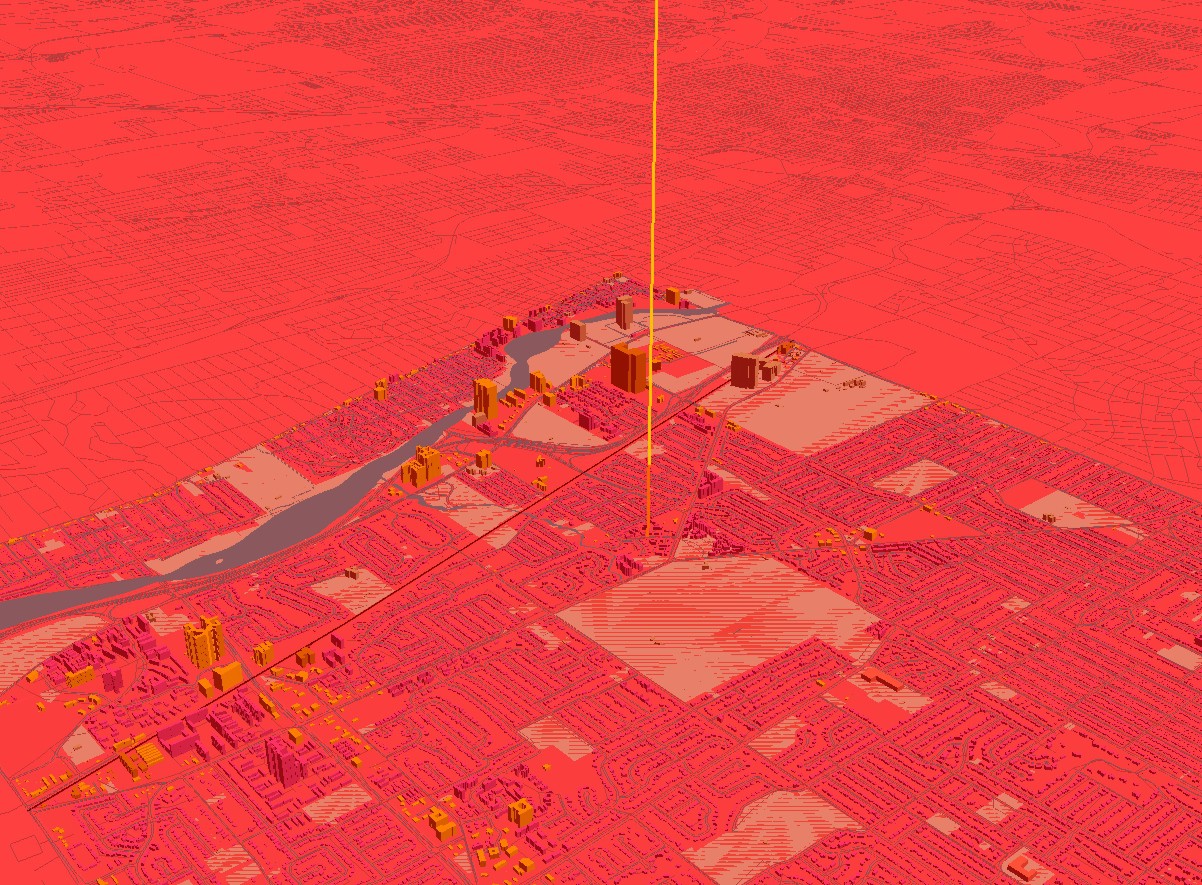
- Figure 4:
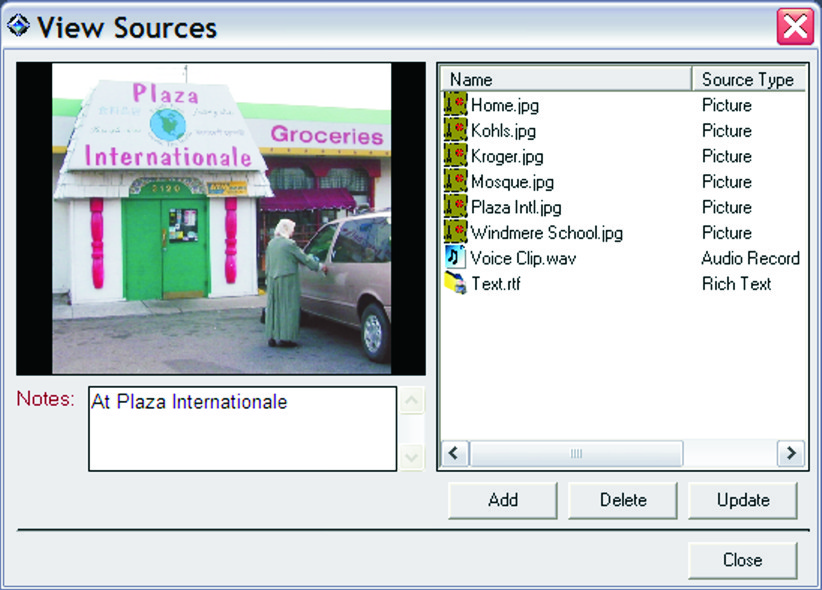
The Source Browser of 3D-VQGIS.
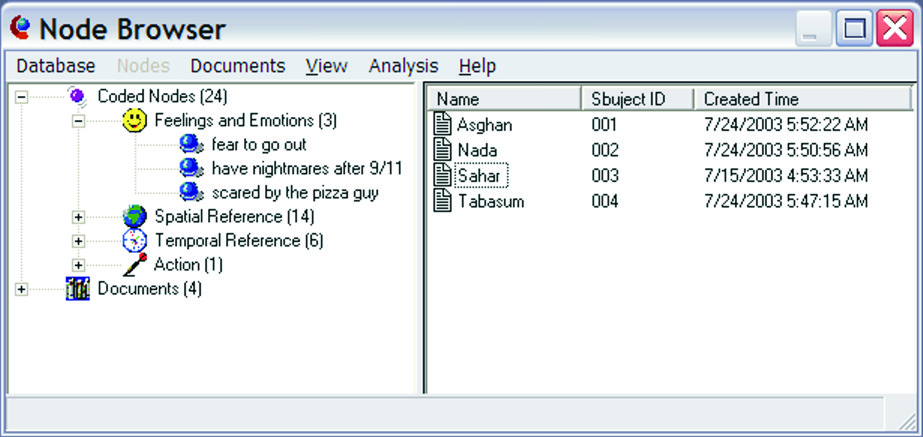
- Figure 5:
The Node Browser of 3D-VQGIS.
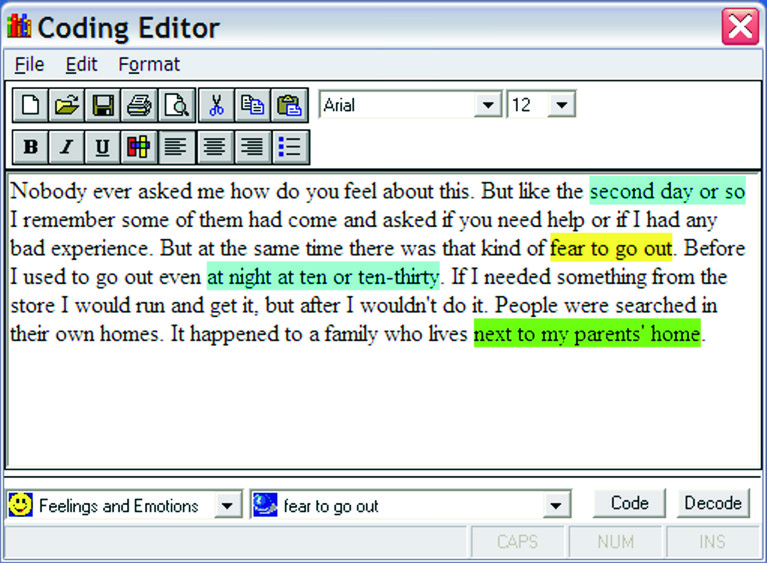
- Figure 6:
The Coding Editor of 3D-VQGIS.
Mei-Po Kwan (2008) From oral histories to visual narratives: Re-presenting the post-September 11
experiences of the Muslim women in the USA. Social and Cultural Geography, 9(6): 653-669.
[Link Page]
- Figure 1:
Nada’s life path on a typical weekday before September 11.
- Figure 2:
Nada’s life path immediately after September 11.
- Figure 3:
Nada’s life path several days after September 11.
- Figure 4:
Nada’s life path several weeks after September 11.
Mei-Po Kwan (2007) Affecting geospatial technologies: Toward a feminist politics of emotion.
The Professional Geographer, 59(1): 22-34.
[Link Page]
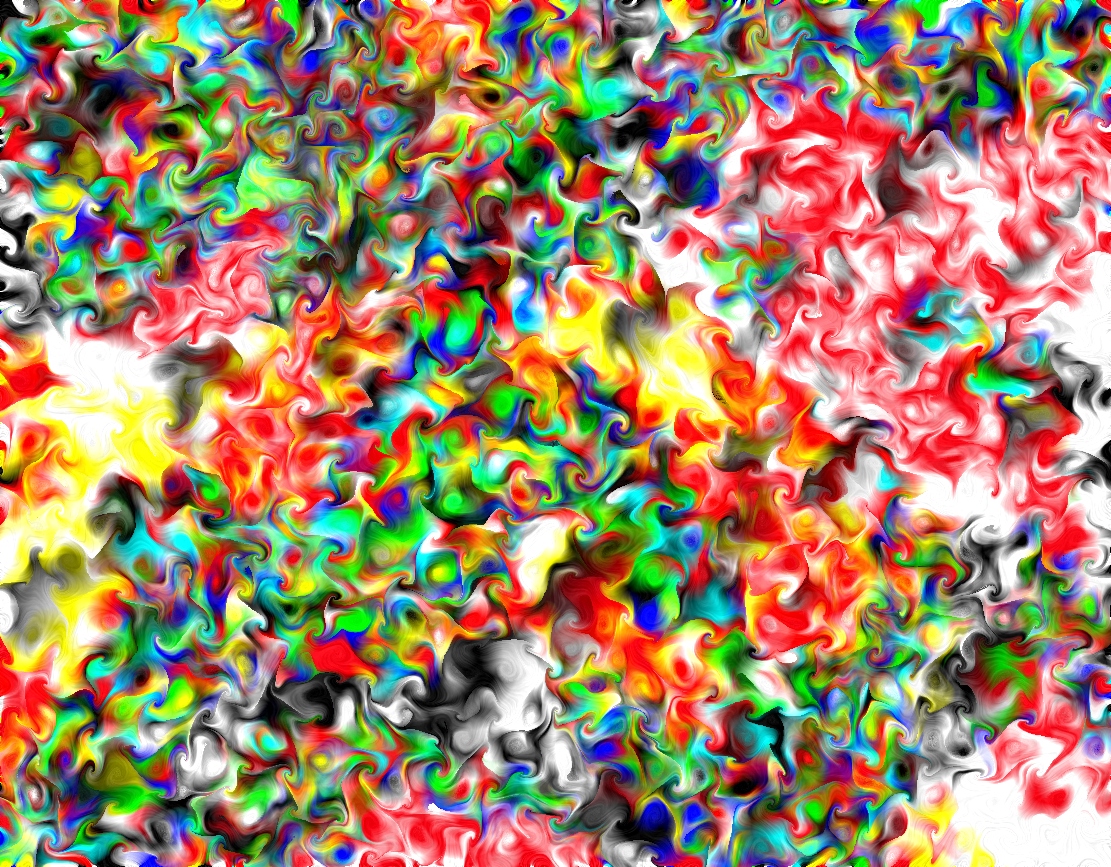
- Figure 1:
Digital image created with three layers of vector data.
Artistic effects were added to the original image with image processing software.
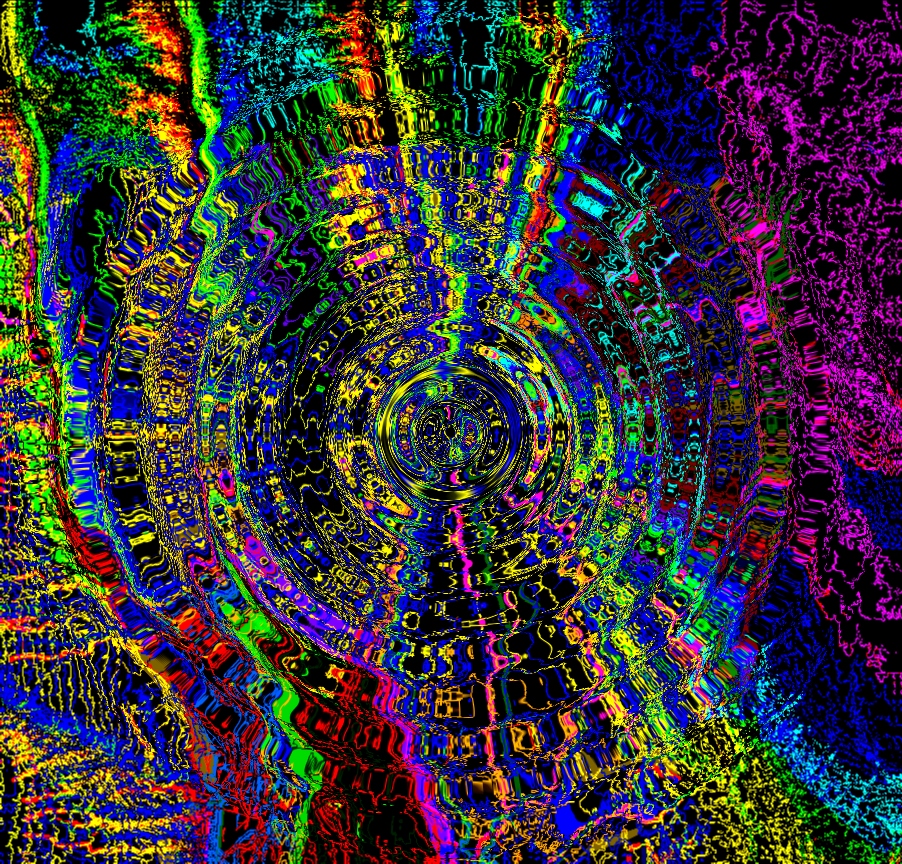
- Figure 2:
Digital image created with Triangulated Irregular Network (TIN) data.
Artistic effects were added to the original image with image processing software.
Mei-Po Kwan and Jiyeong Lee (2004) Geovisualization of Human Activity Patterns Using 3D GIS:
A Time-Geographic Approach. In Michael Goodchild and Donald Janelle, eds.,
Spatially Integrated Social Science, 48-66. New York: Oxford University Press.
[Link Page]
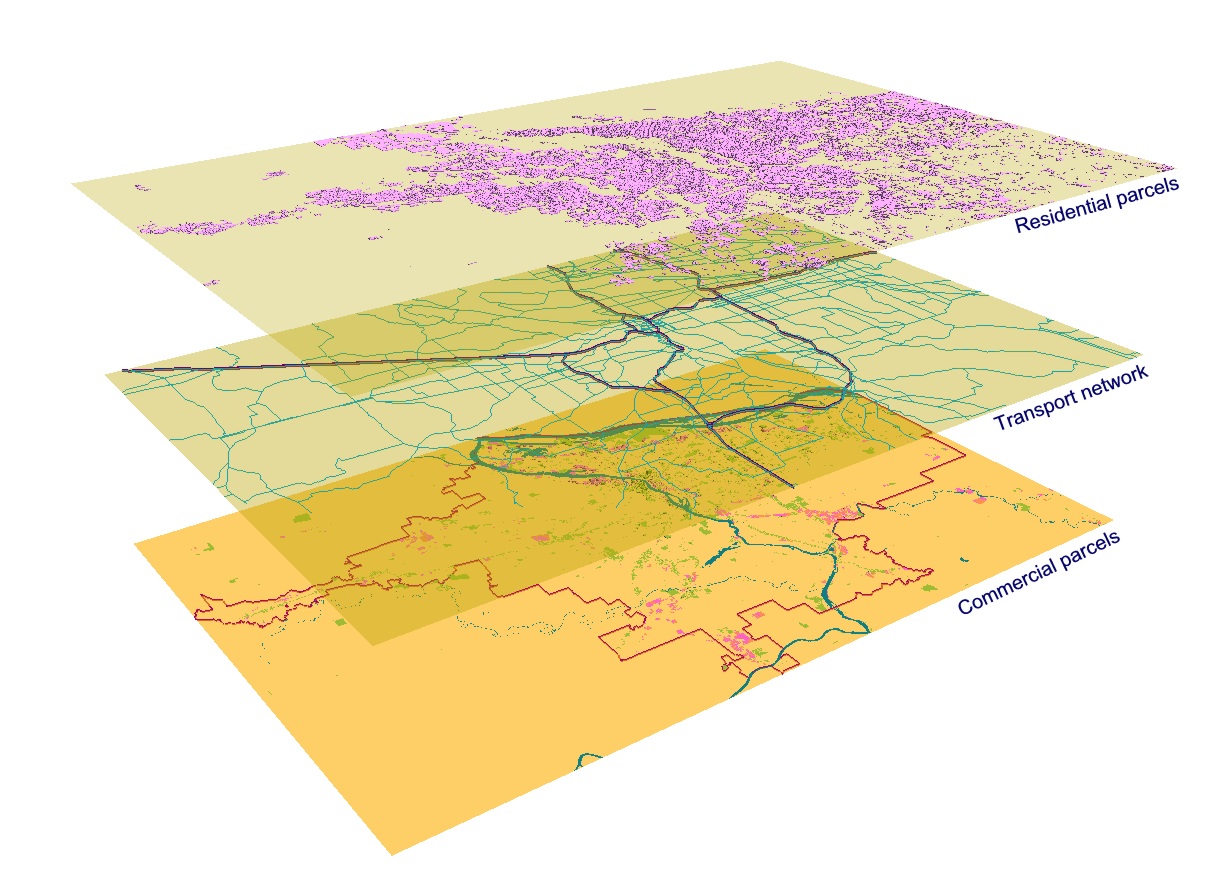
- Figure 1: Three layers of geographical data used in the
study.
- Figure 2: Simple activity patterns in space-time.
- Figure 3: Activity density patterns in geographic space.
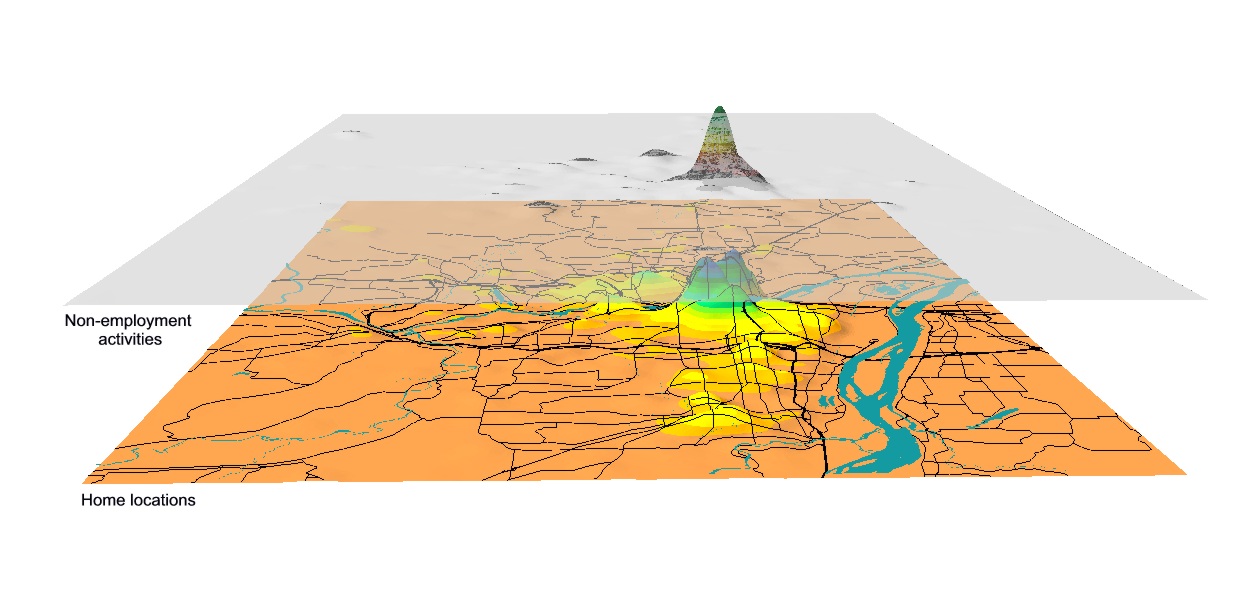
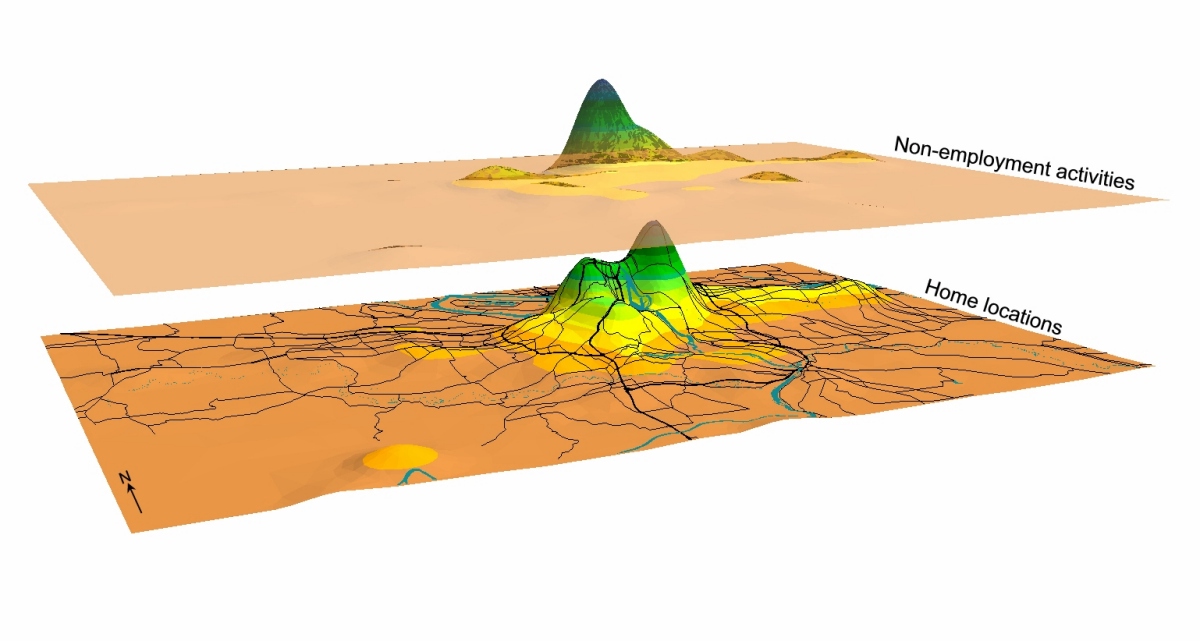
- Figure 4: A close-up view of the density surface of home locations
of the selected individuals.
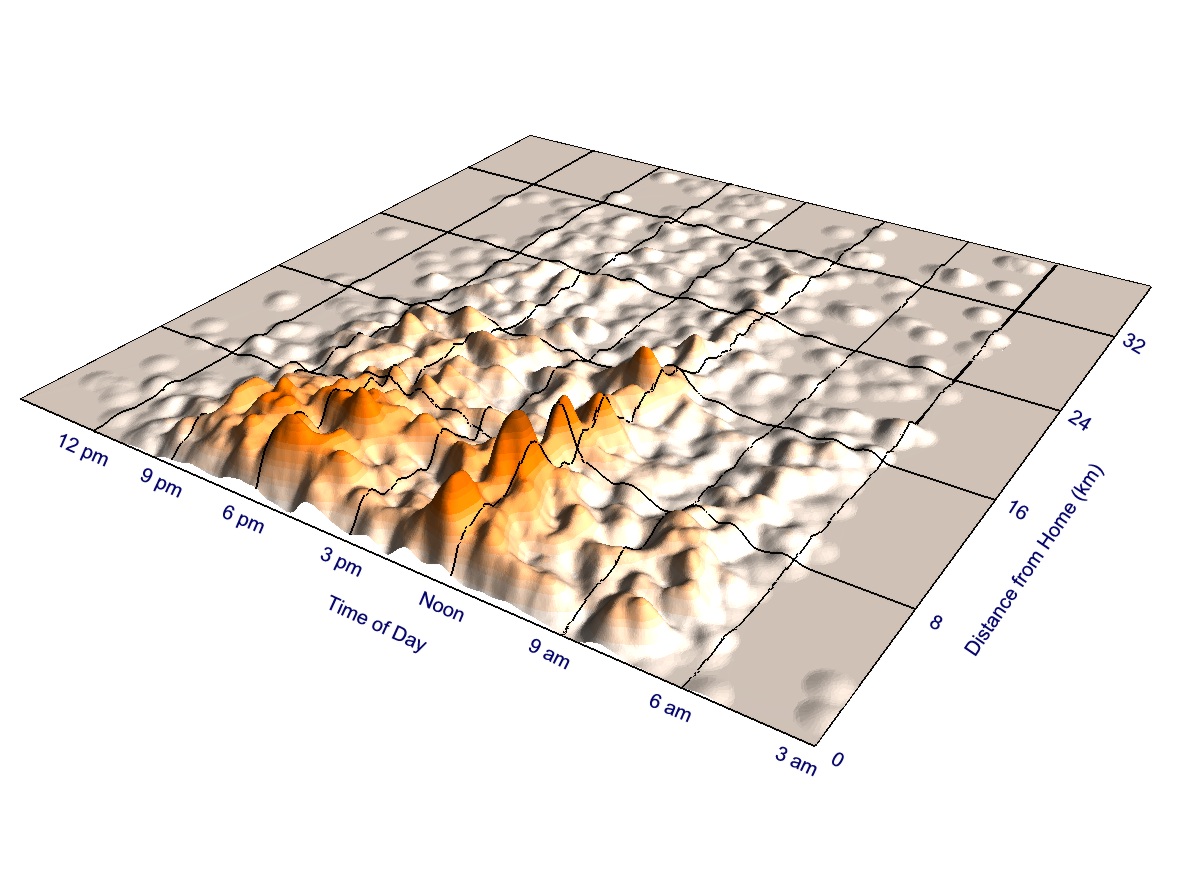
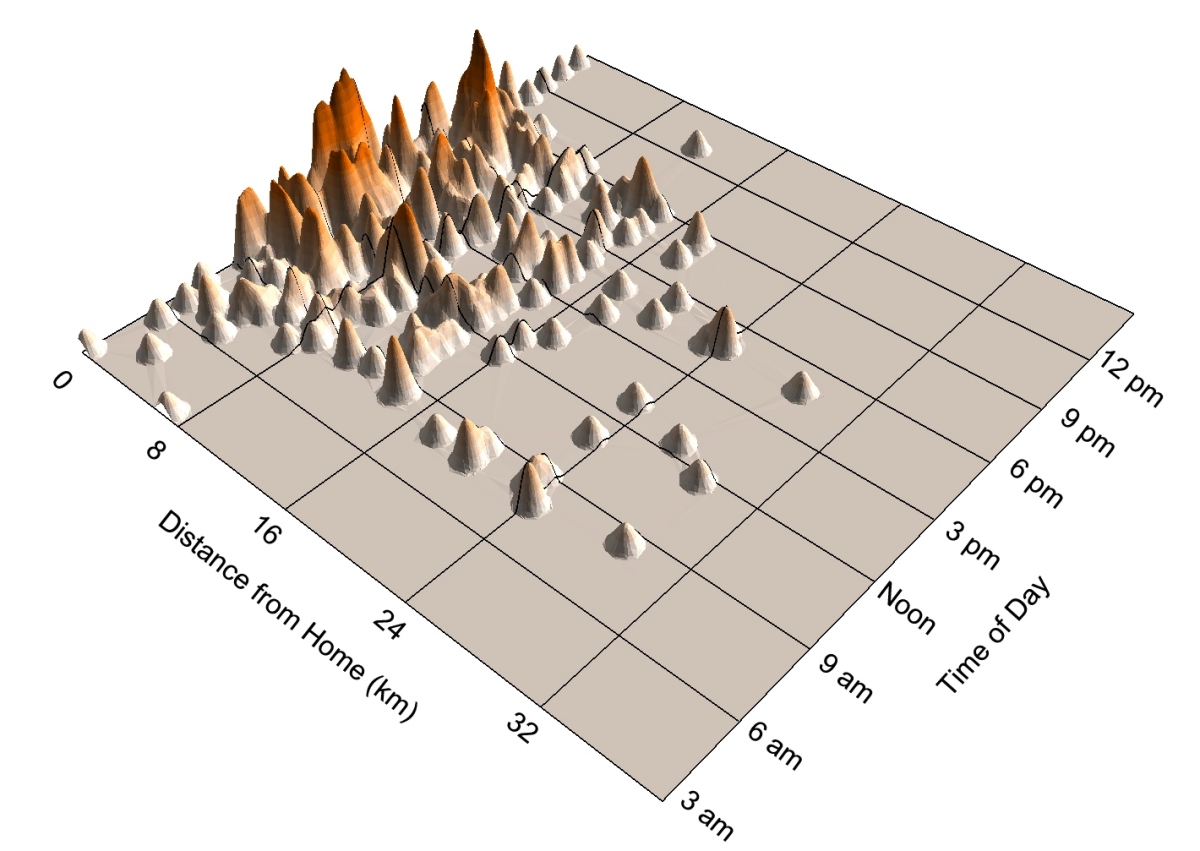
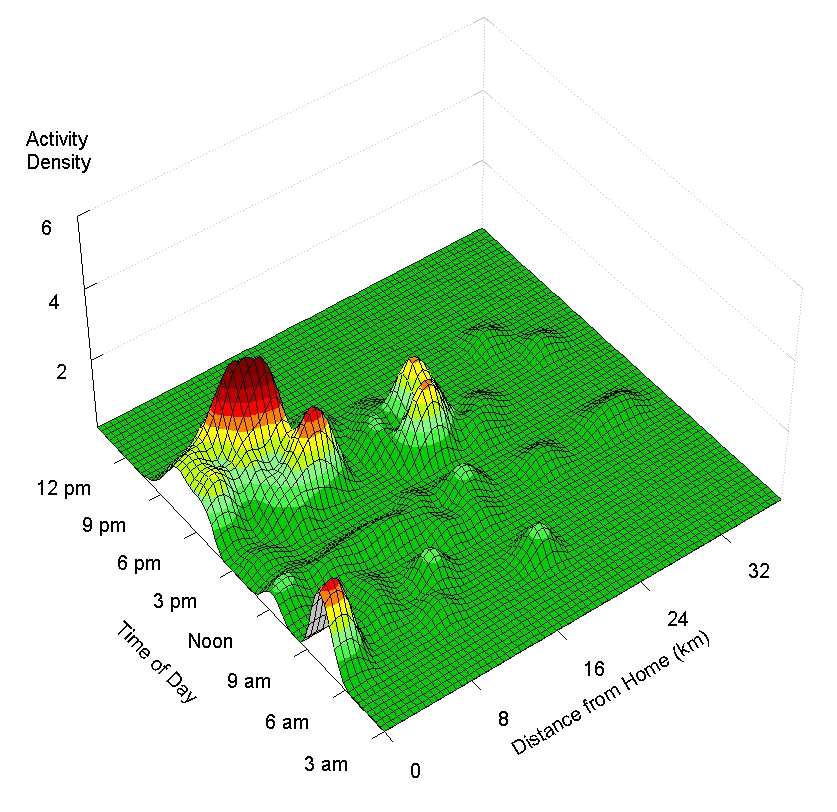
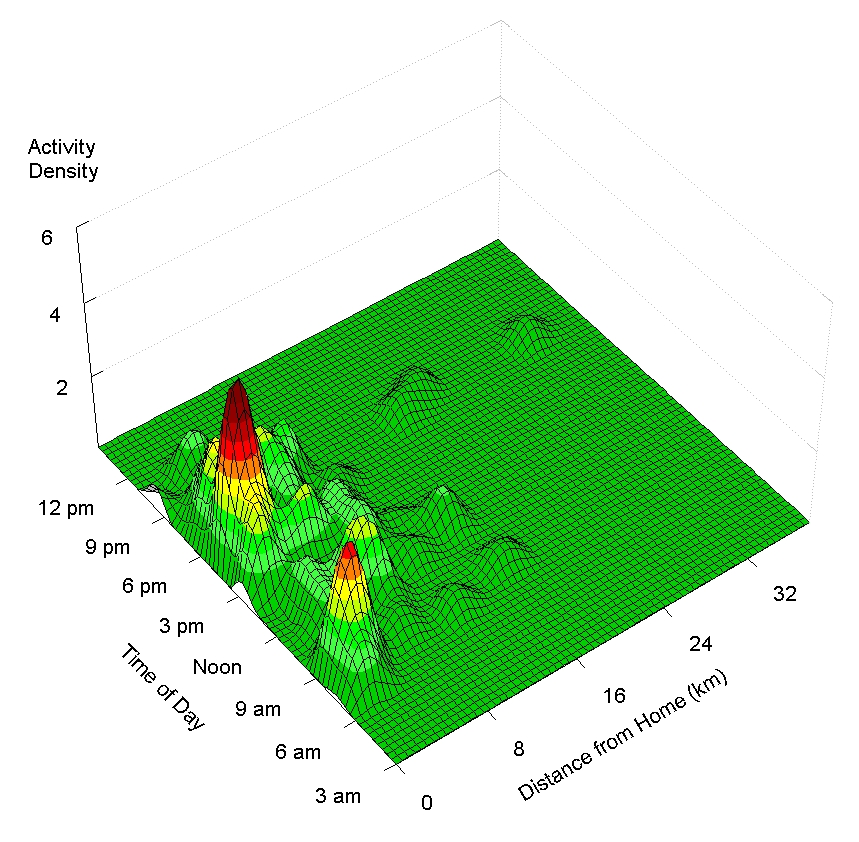
- Figure 5: Space-time activity density of the non-employment activities
of the full-time employed women in the sample.
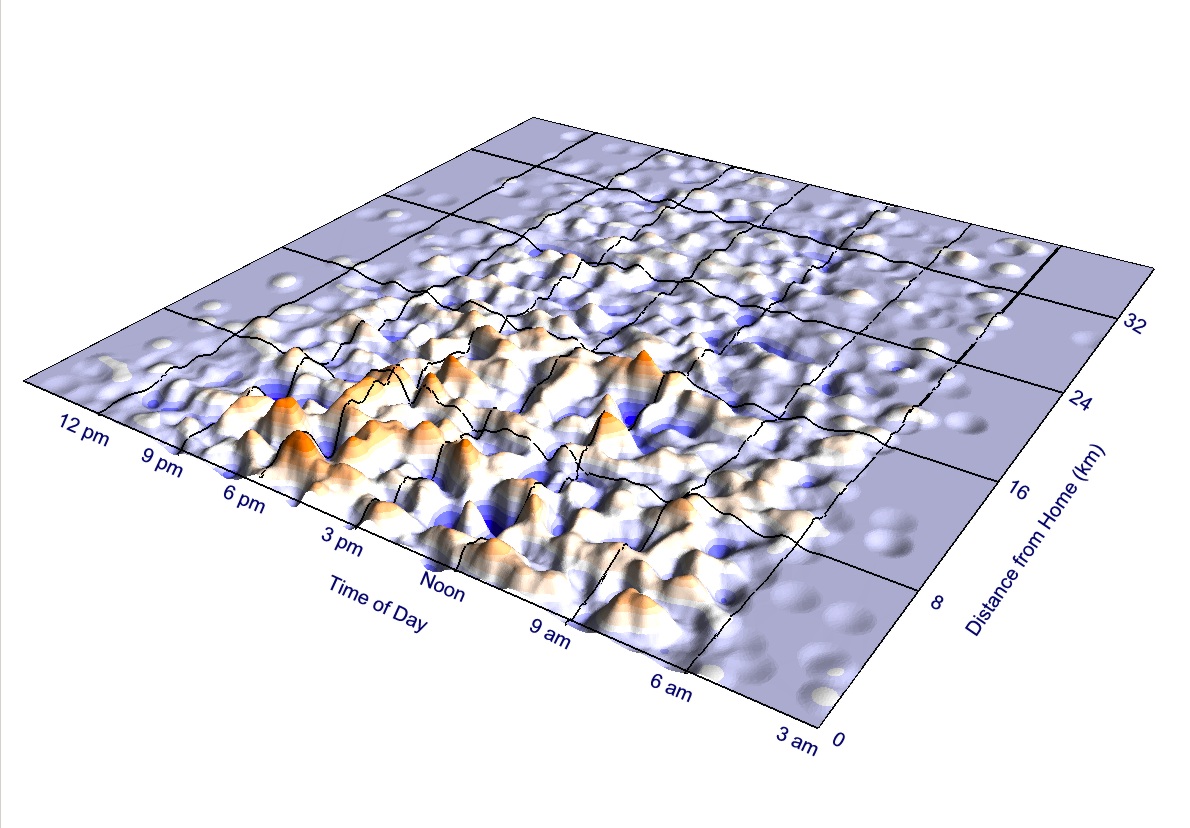
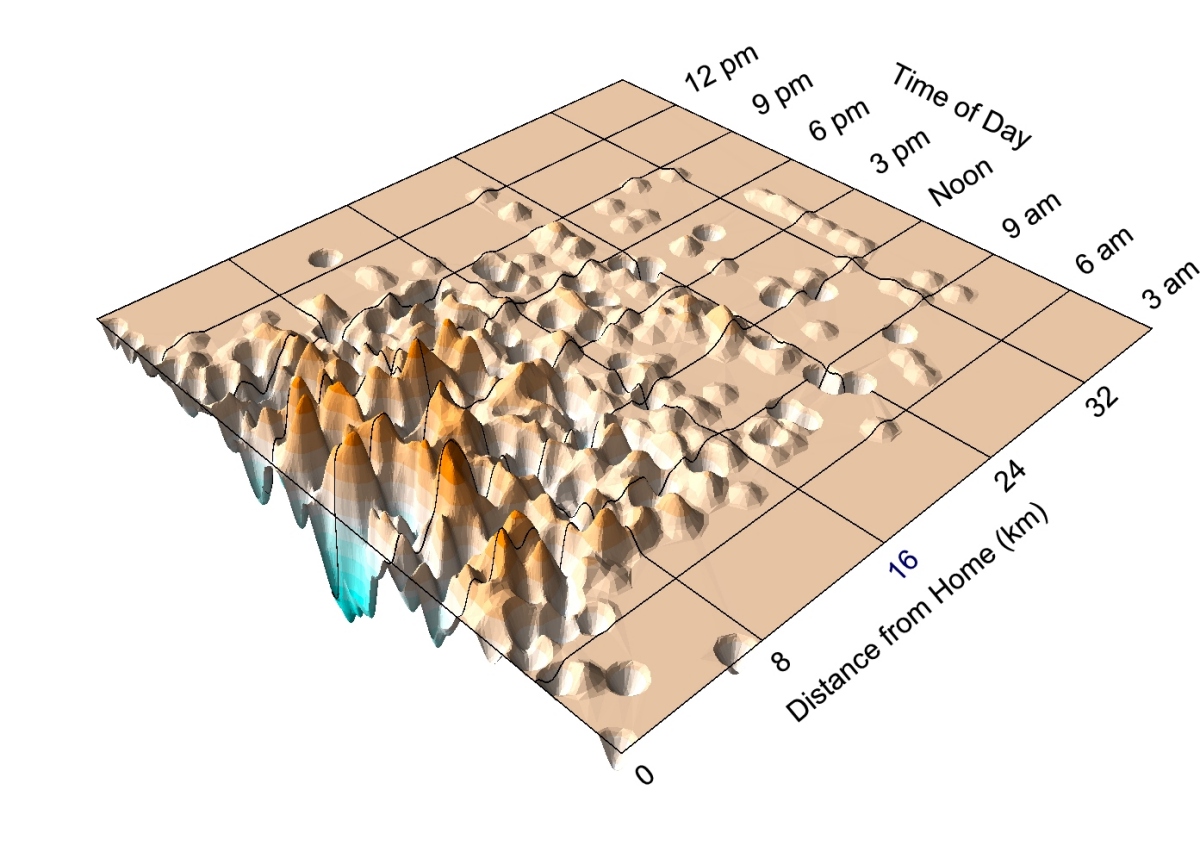
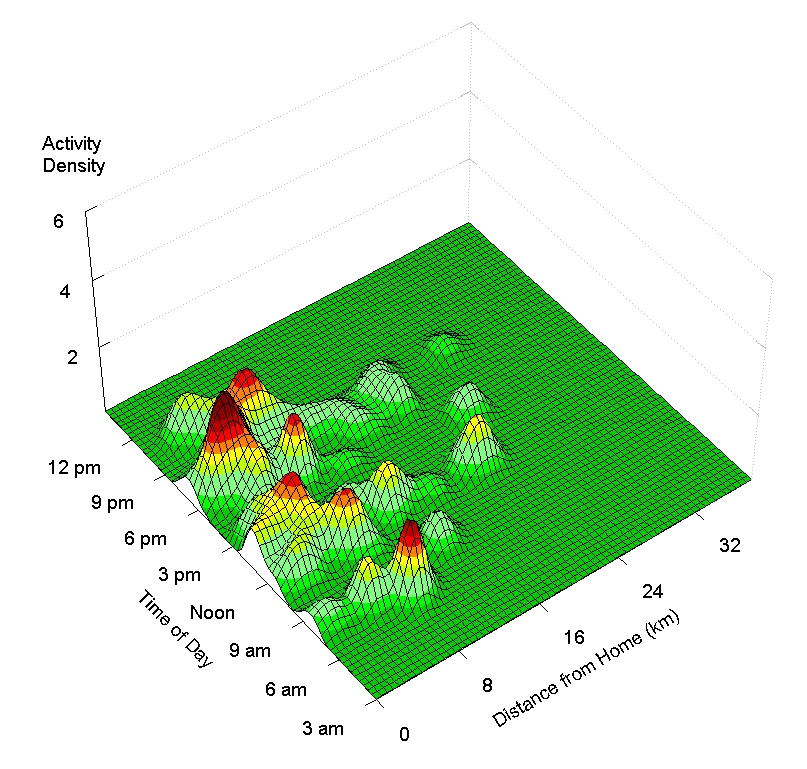
- Figure 6: Gender difference in the space-time density of non-employment
activities between the full-time employed women and men in the sample.
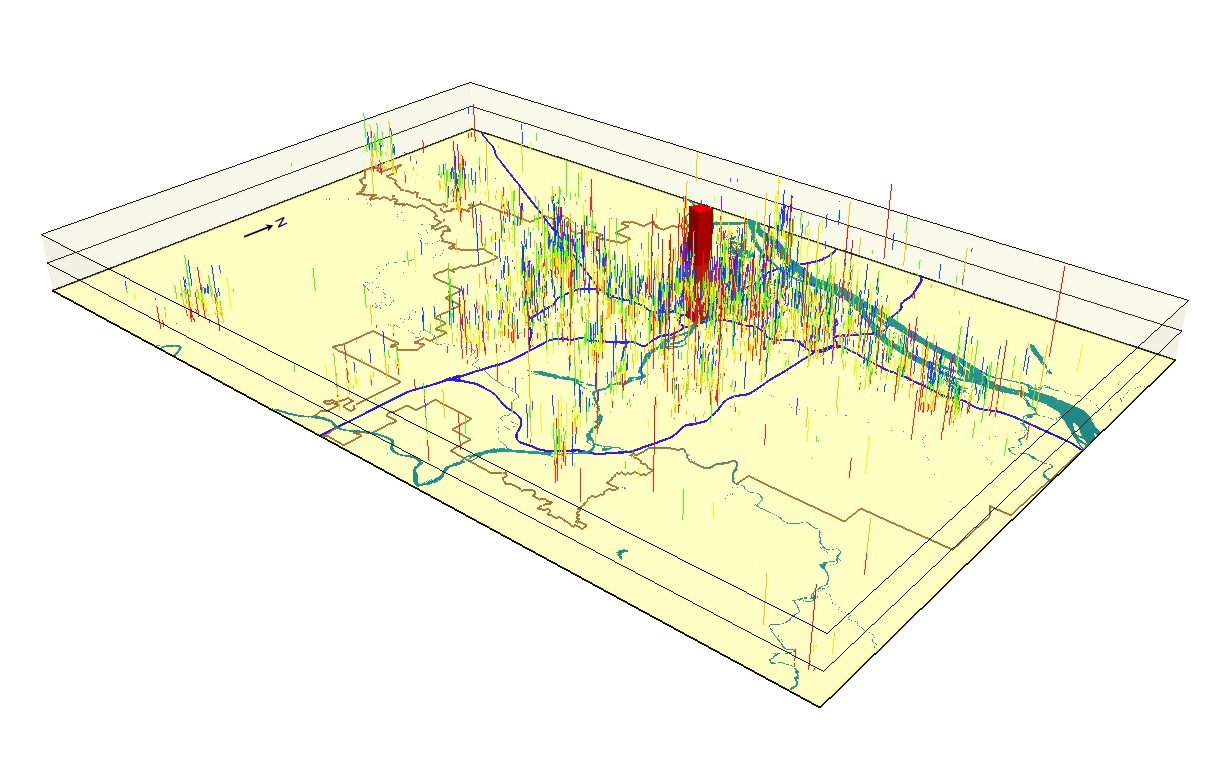
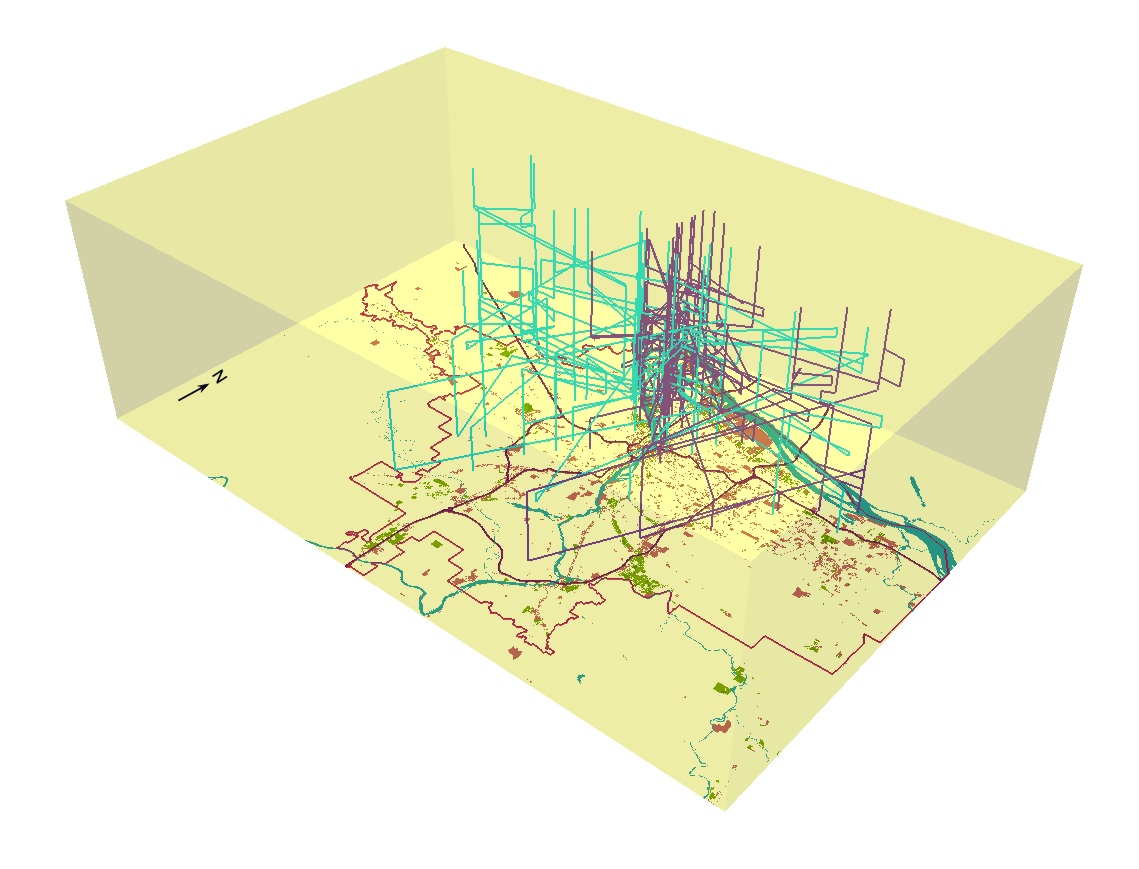
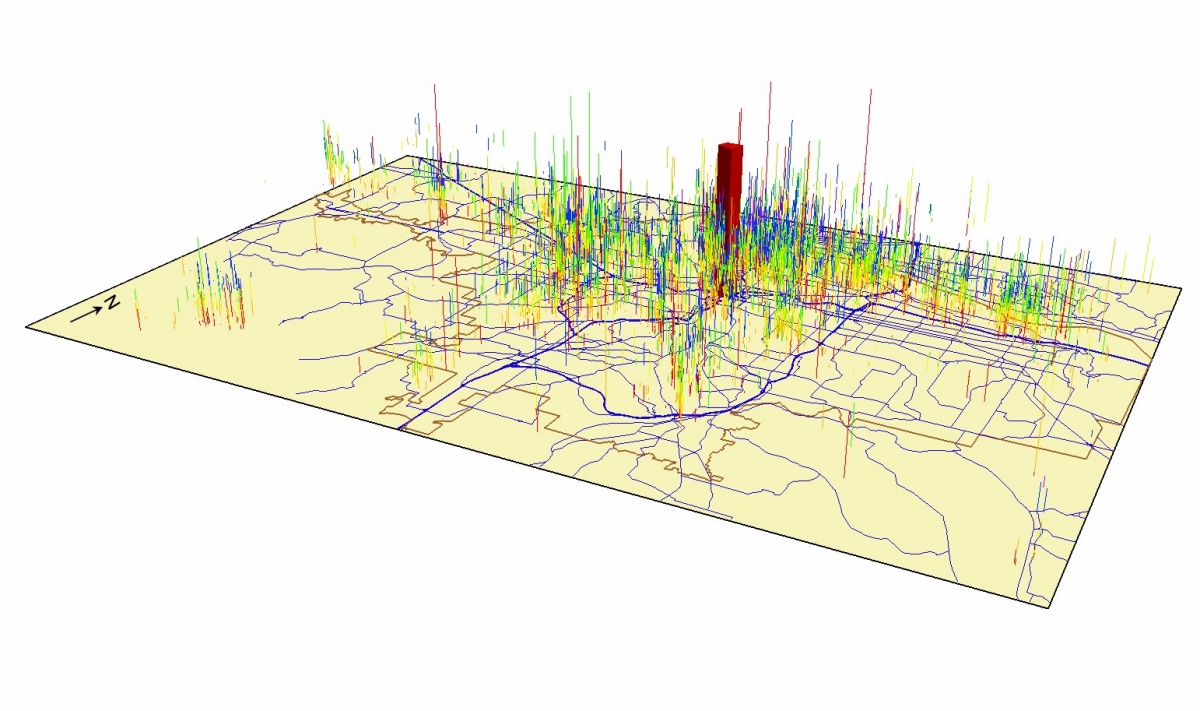
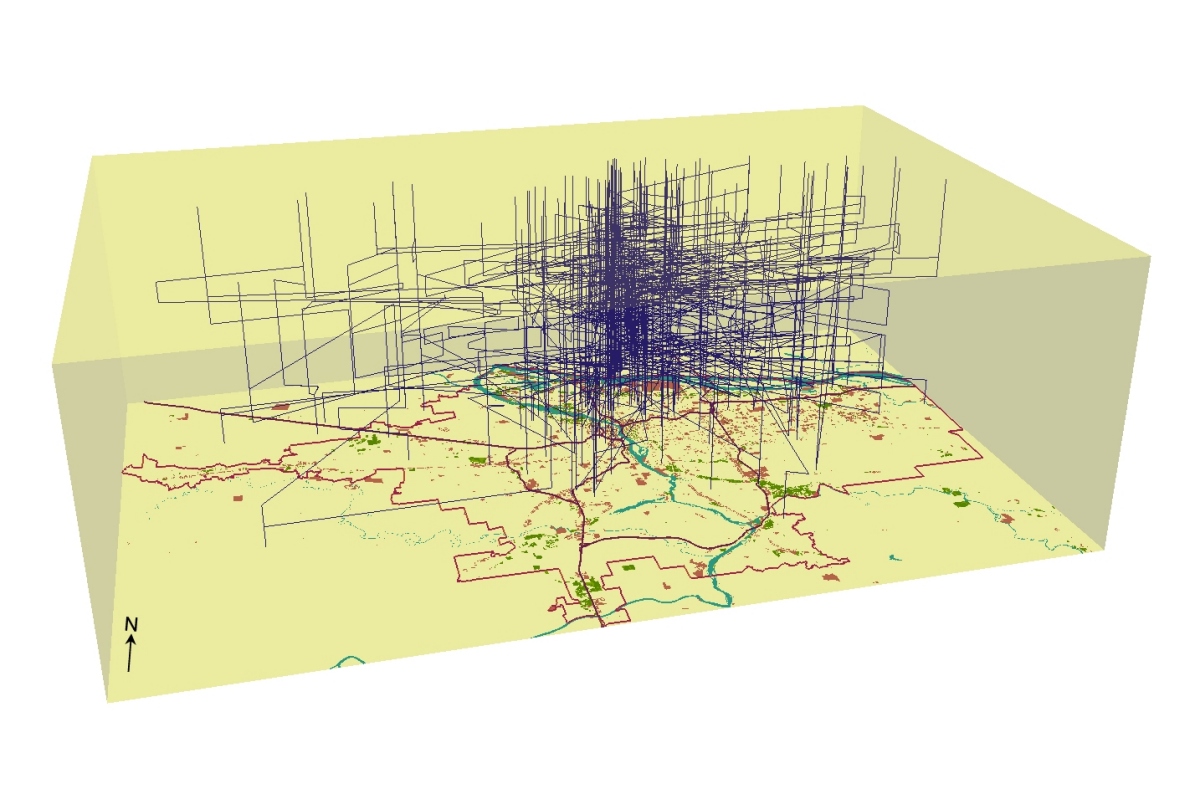
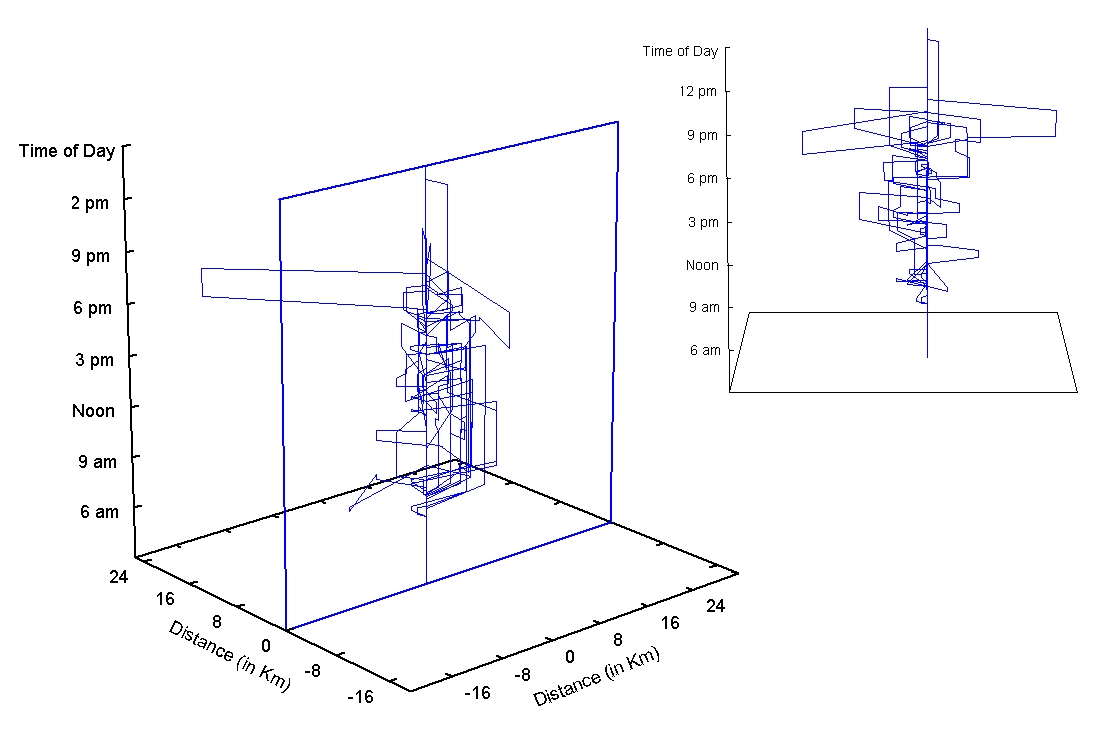
- Figure 7: Space-time aquarium showing the space-time paths of African and
Asian Americans in the sample.
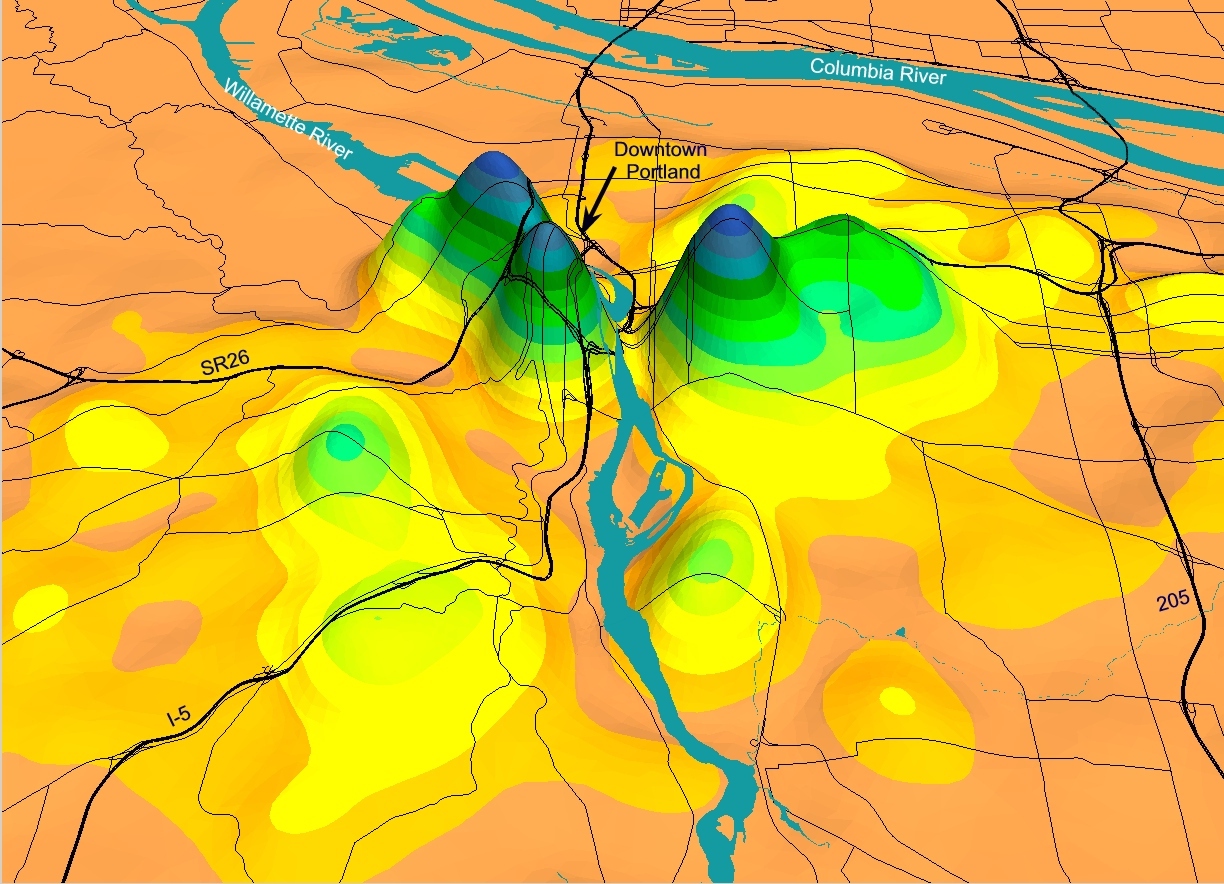
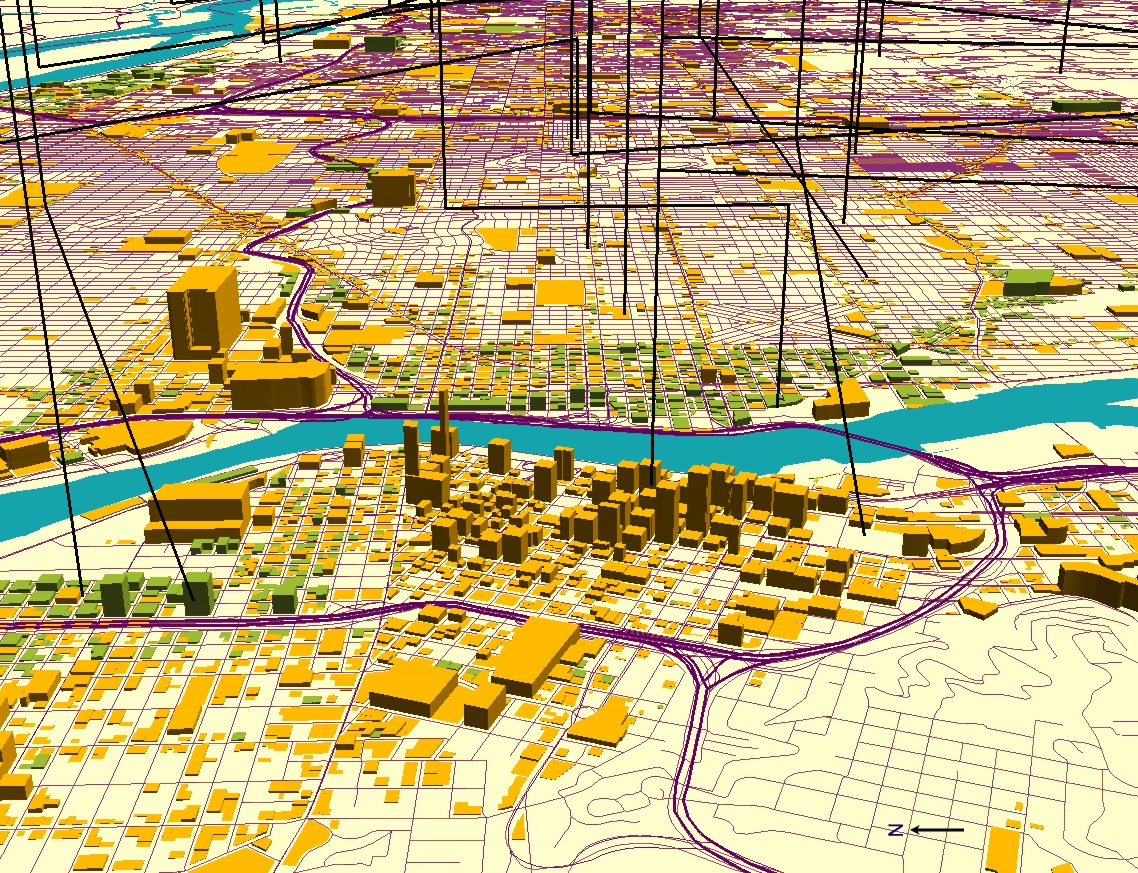
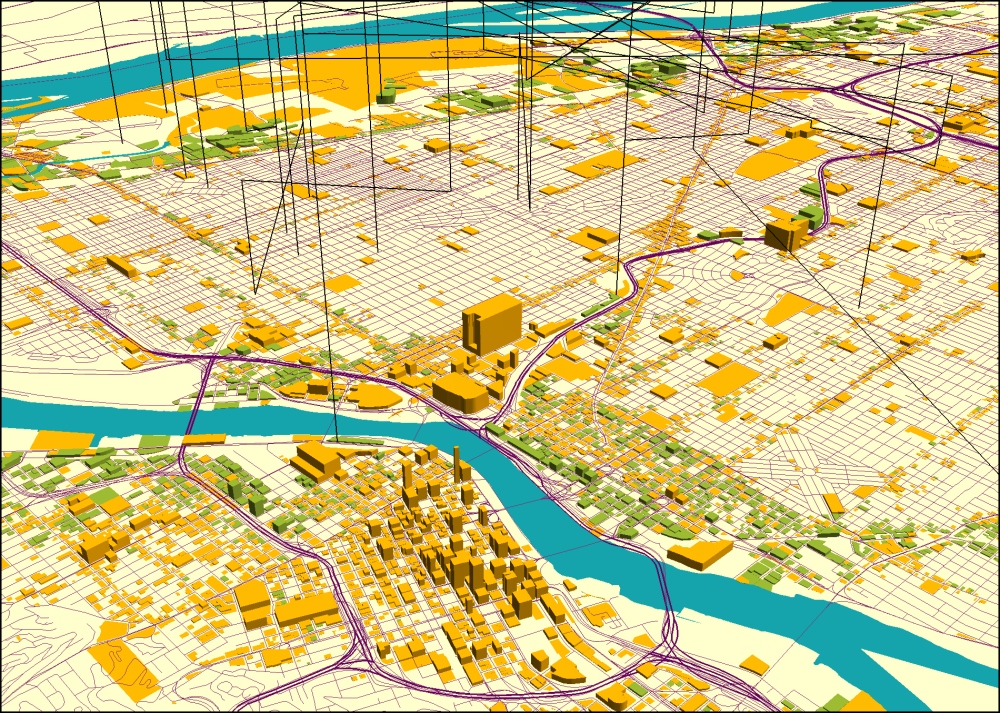
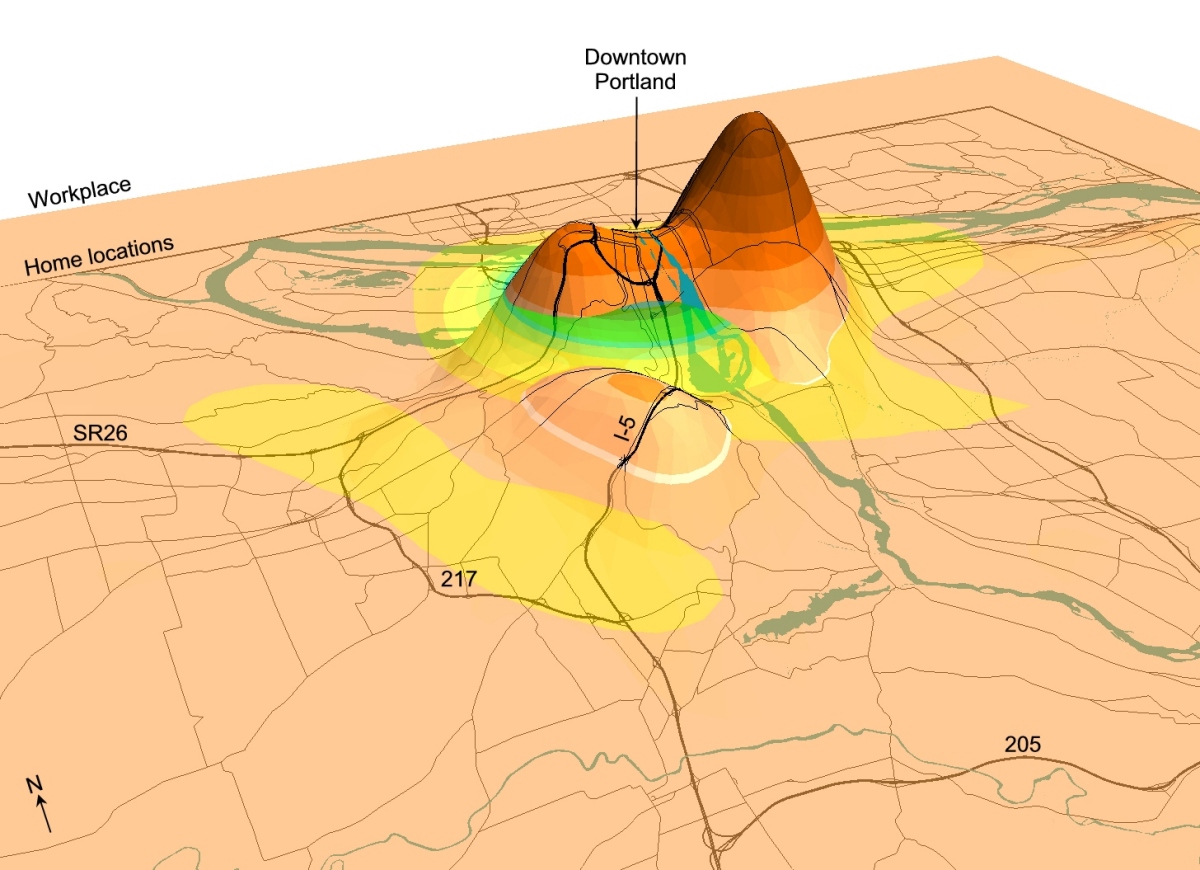
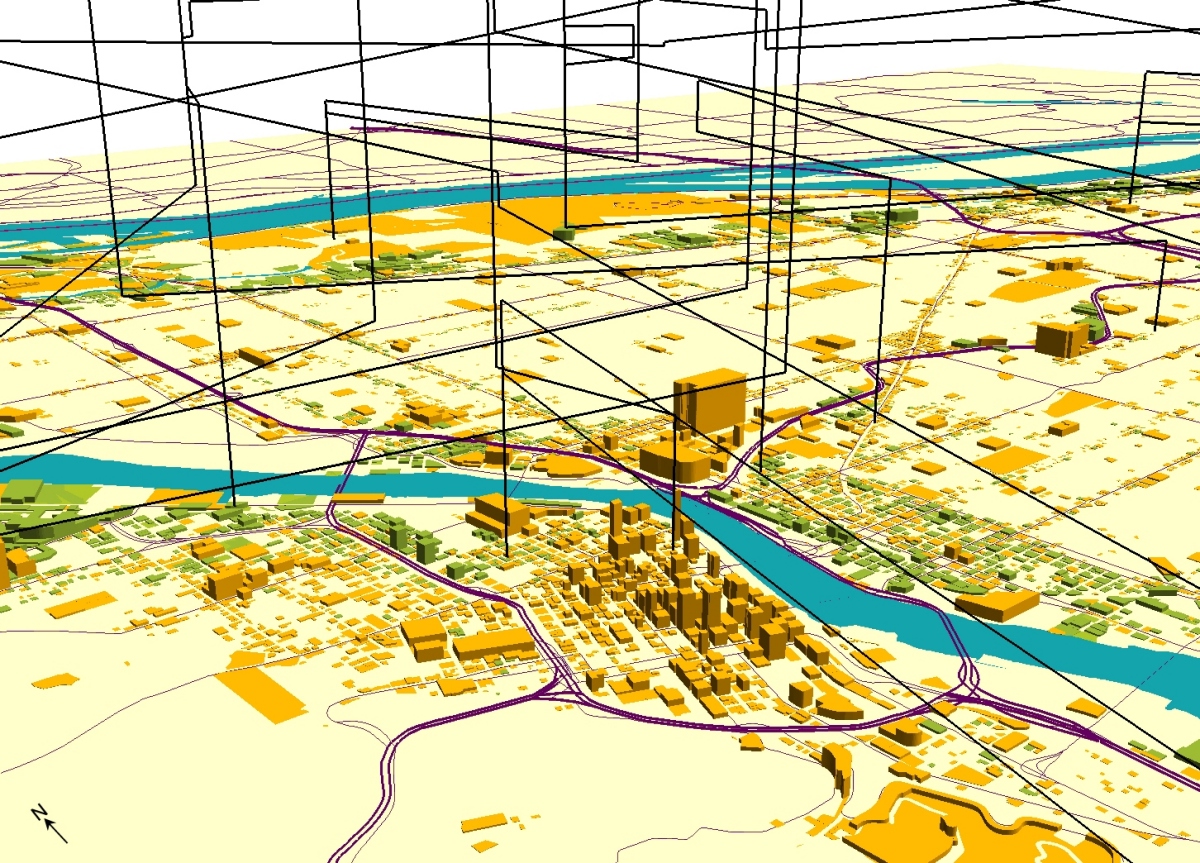
- Figure 8: A close-up view of downtown Portland.
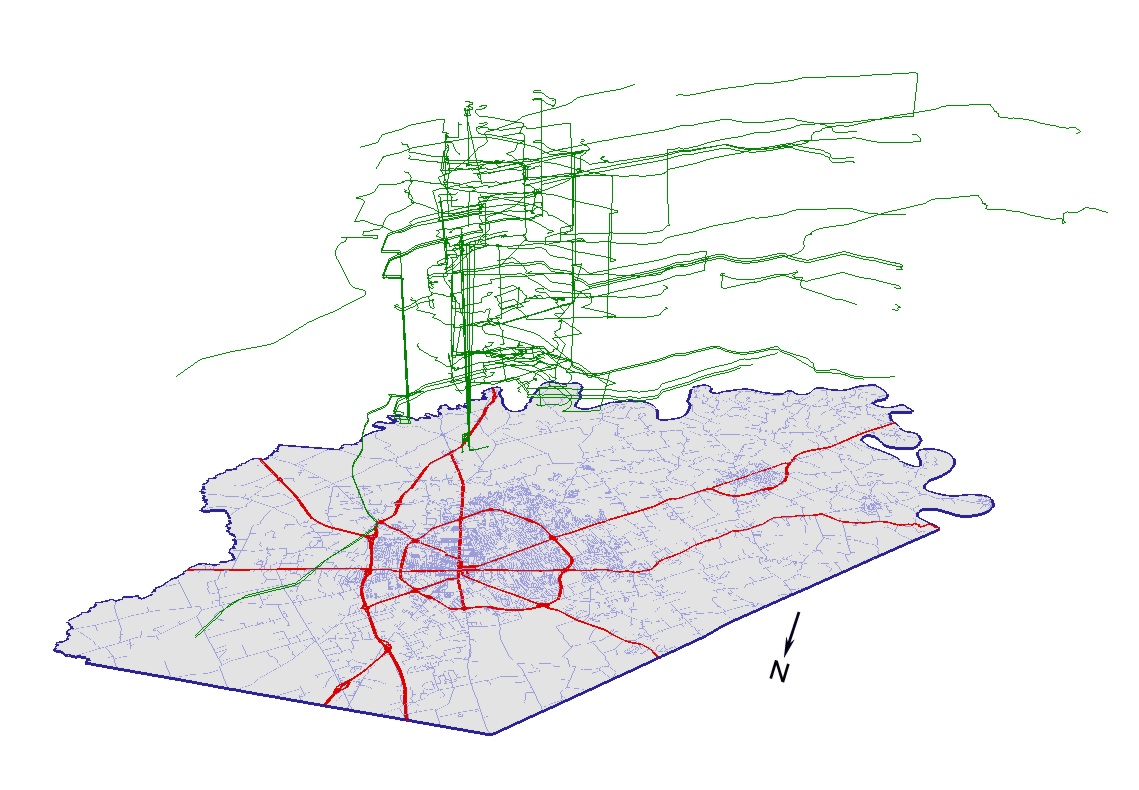
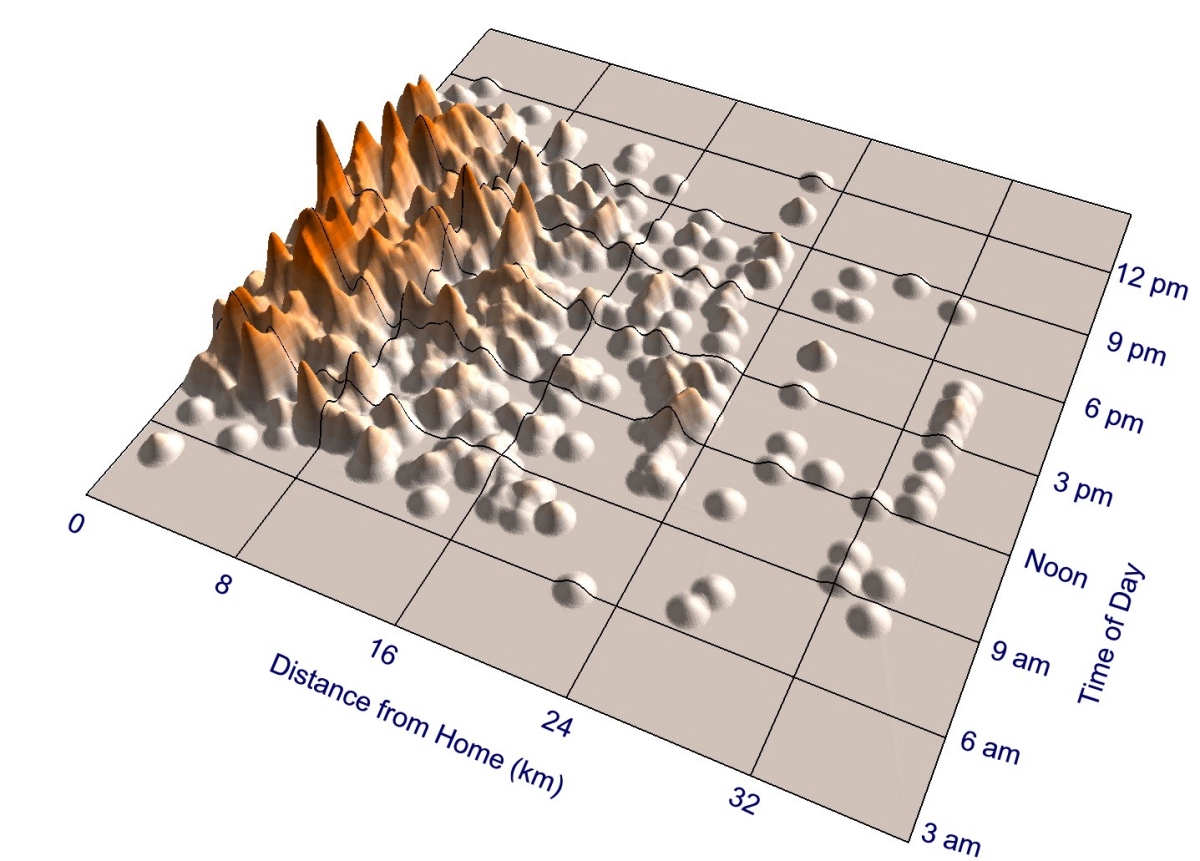
- Figure 9: Space-time paths based on GPS data collected in Lexington,
Kentucky.
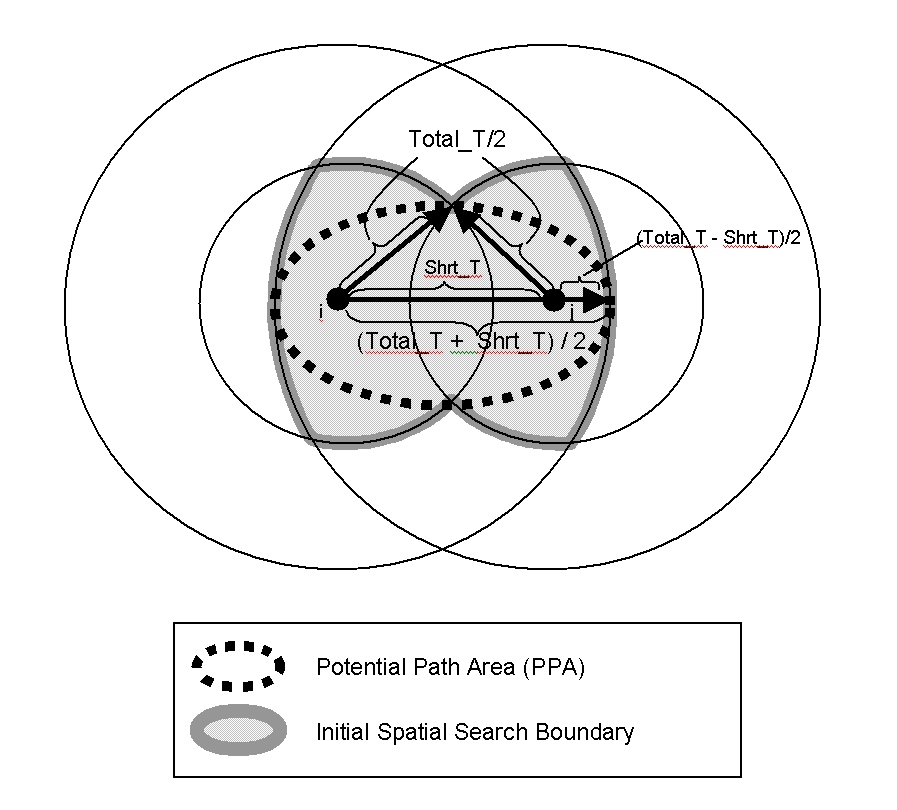
Hyun-Mi Kim and Mei-Po Kwan (2003) Space-time Accessibility Measures: A Geocomputational
Algorithm with a Focus on the Feasible Opportunity Set and Possible Activity Duration.
Journal of Geographical Systems, 5(1):71-91.
[Link Page]
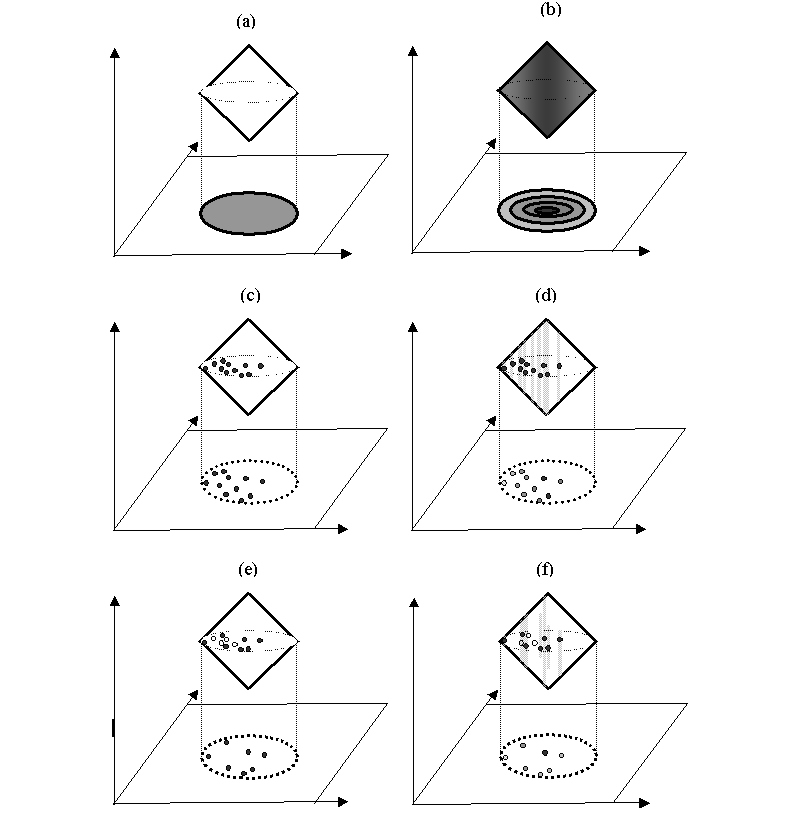
- Figure 1: Different approaches to evaluating
space-time accessibility of individuals.
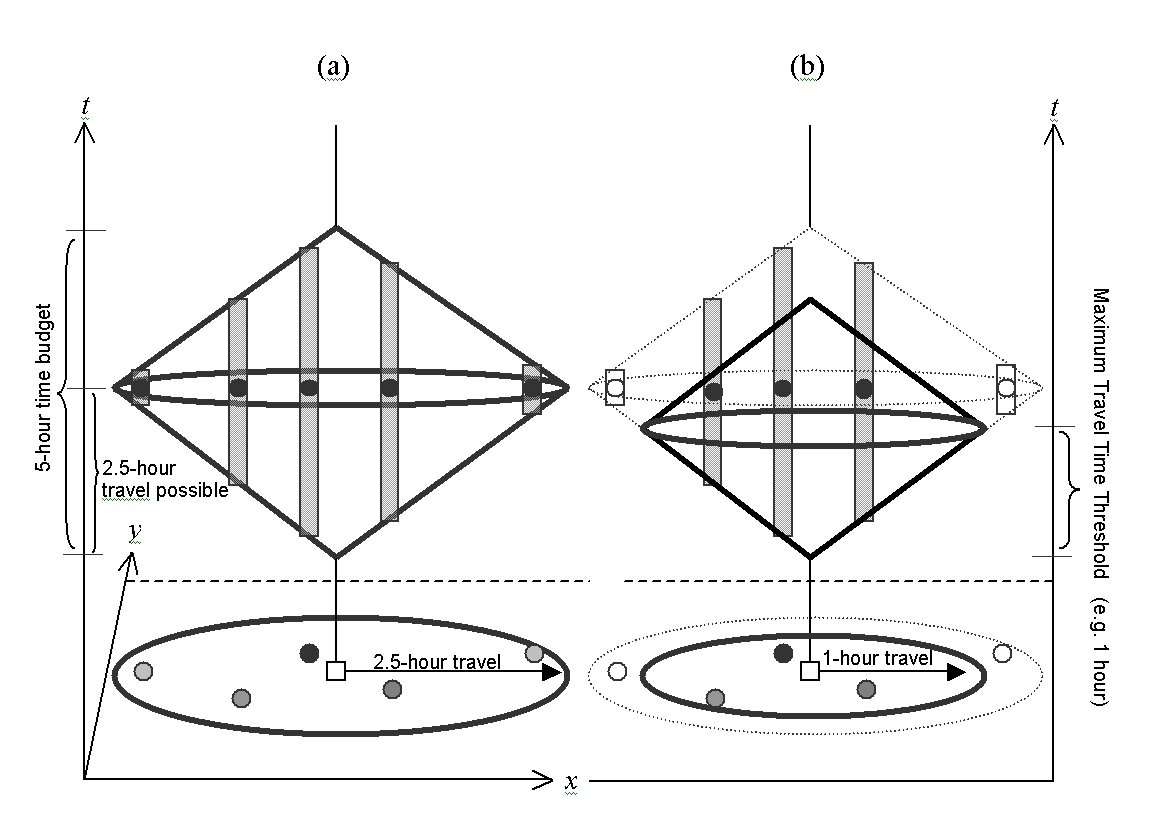
- Figure 2: The effect of the maximum travel time
threshold on the space-time prism and potential path area (PPA).
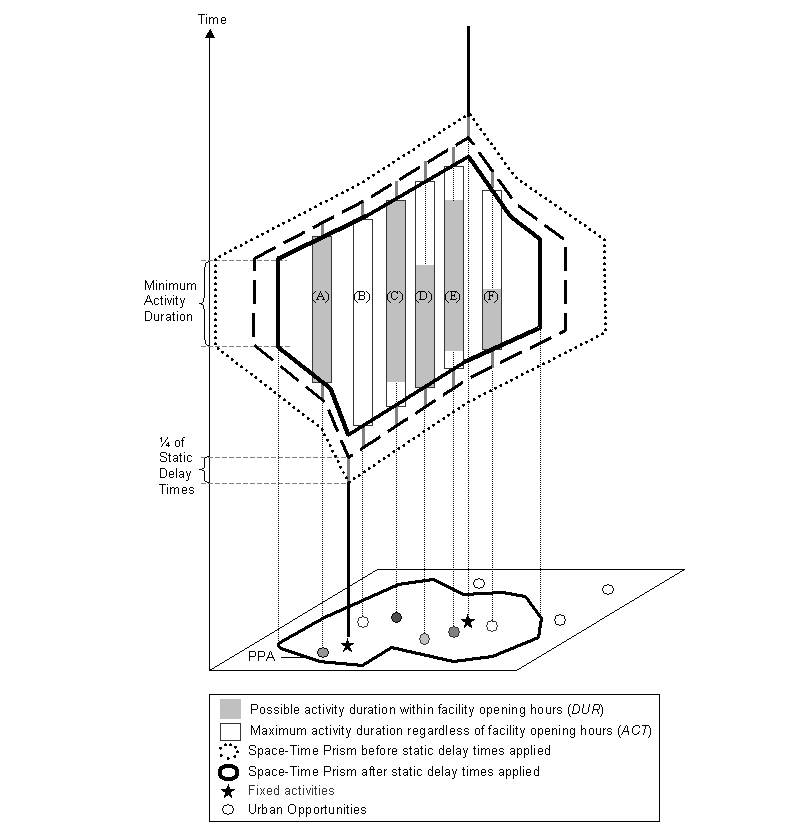
- Figure 3: The proposed conceptual framework.
- Figure 4: Procedures implemented by the geocomputational
algorithm.
- Figure 5: The opportunity set delimited in Step 1.
- Figure 6: The opportunity set delimited in Step 2.
- Figure 7: The opportunity set delimited in Step 3.
- Figure 8: The spatial pattern of possible activity duration.
Mei-Po Kwan (2002) Feminist Visualization: Re-envisioning GIS as a Method in Feminist
Geographic Research. Annals of the Association of American Geographers,
(2002) 92(4):645-661.
[Link Page]
- Figure 1: The space-time paths of a sample of African-American
women in Portland, Oregon.
- Figure 2: A detailed view of an area close to downtown
Portland, Oregon.
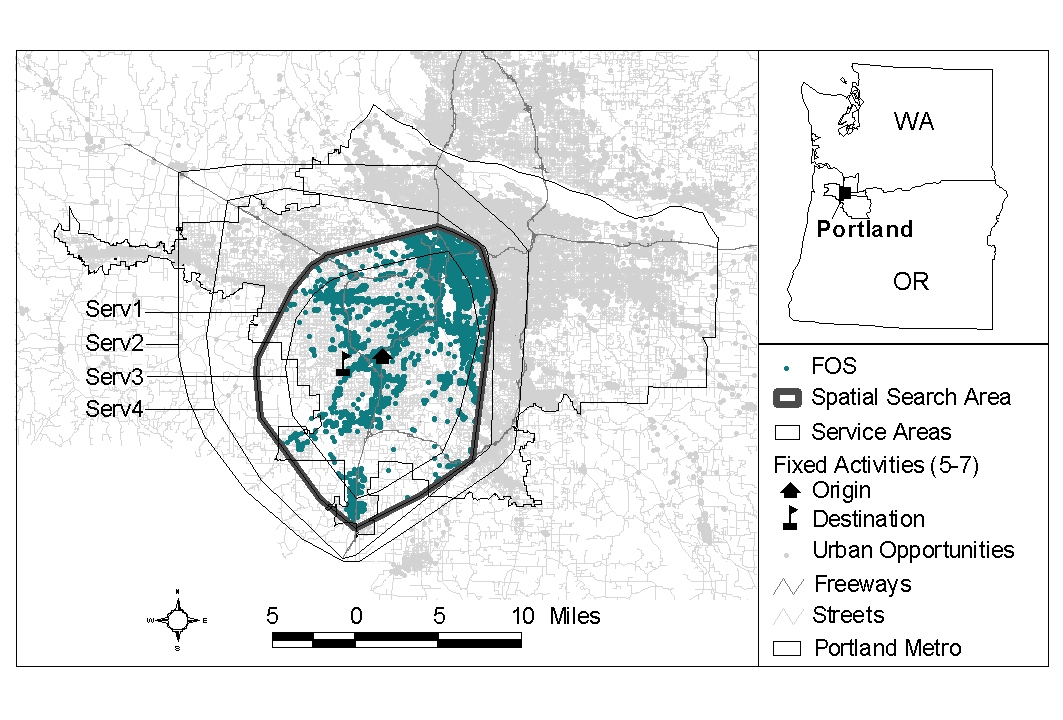
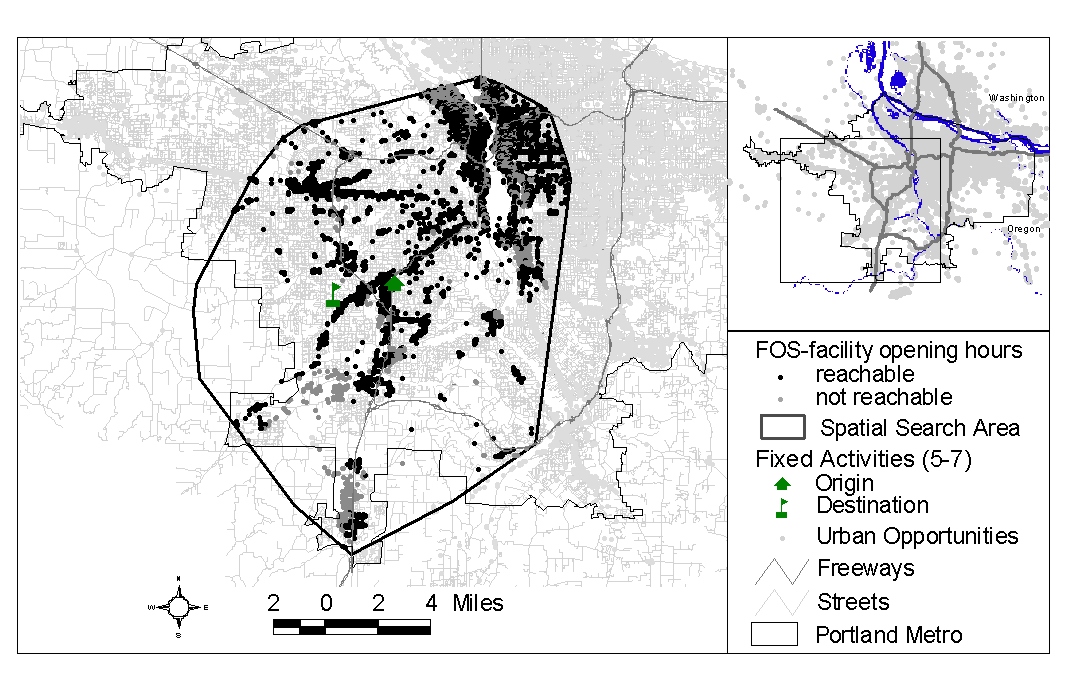
Joe Weber and Mei-Po Kwan (2002) Bringing Time Back In: A Study on the Influence of Travel
Time Variations and Facility Opening Hours on Individual Accessibility. The Professional
Geographer, 54(2):226-240.
[Link Page]
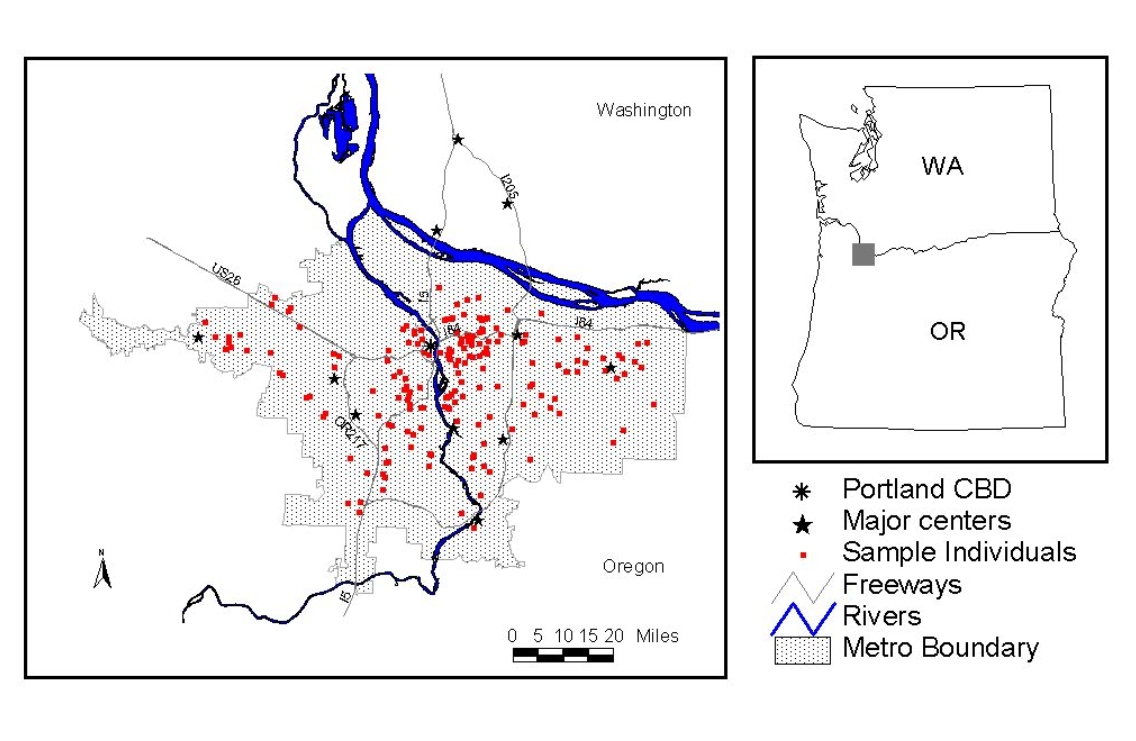
- Figure 1: Portland, Oregon, study area.
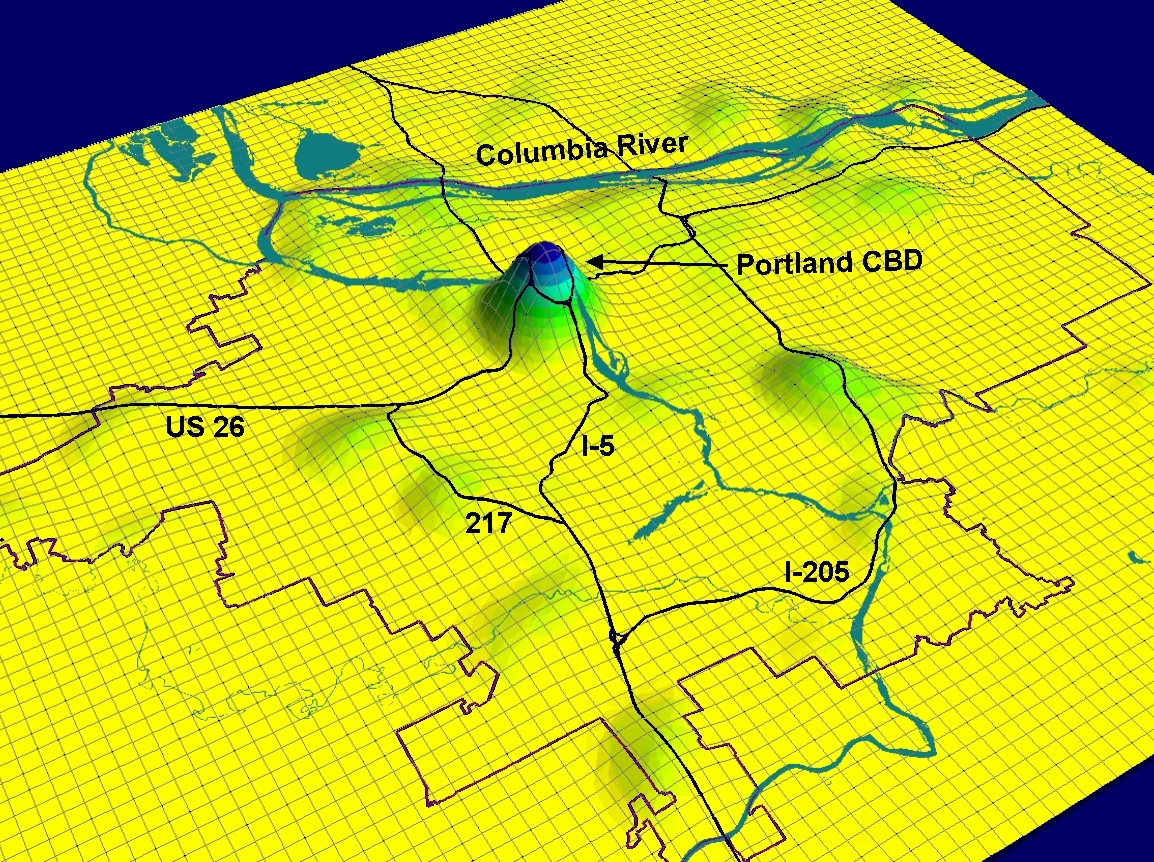
- Figure 2: Weighted opportunity density surface of Portland
study area.
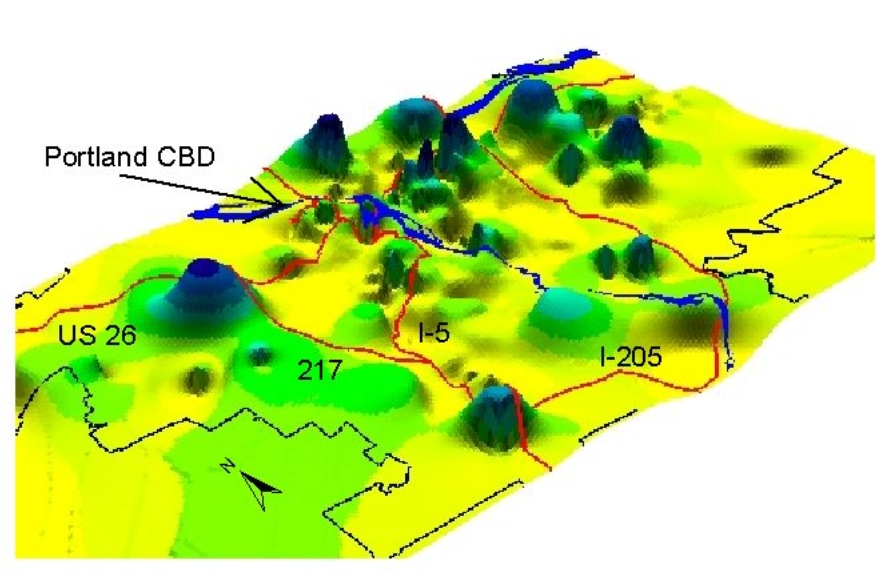
- Figure 3: Weighted opportunity individual accessibility
surface for Portland study area.
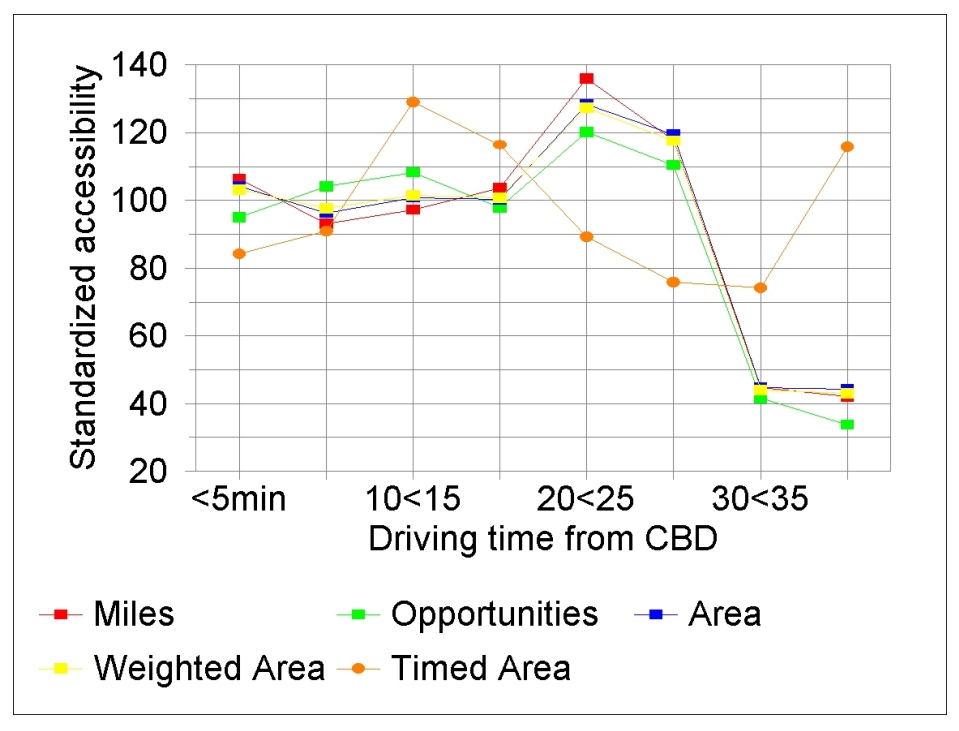
- Figure 4: Average individual accessibility by distance
from the Portland Central Business District (CBD).
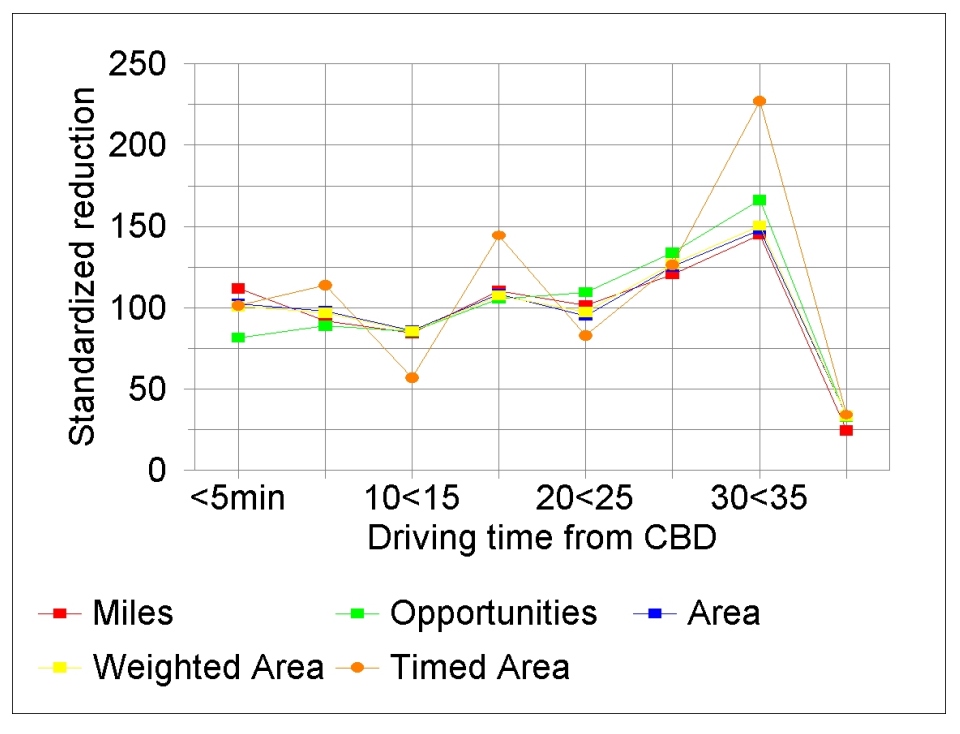
- Figure 5: Average percent reduction in individual accessibility
by distance from the Portland Central Business District (CBD).
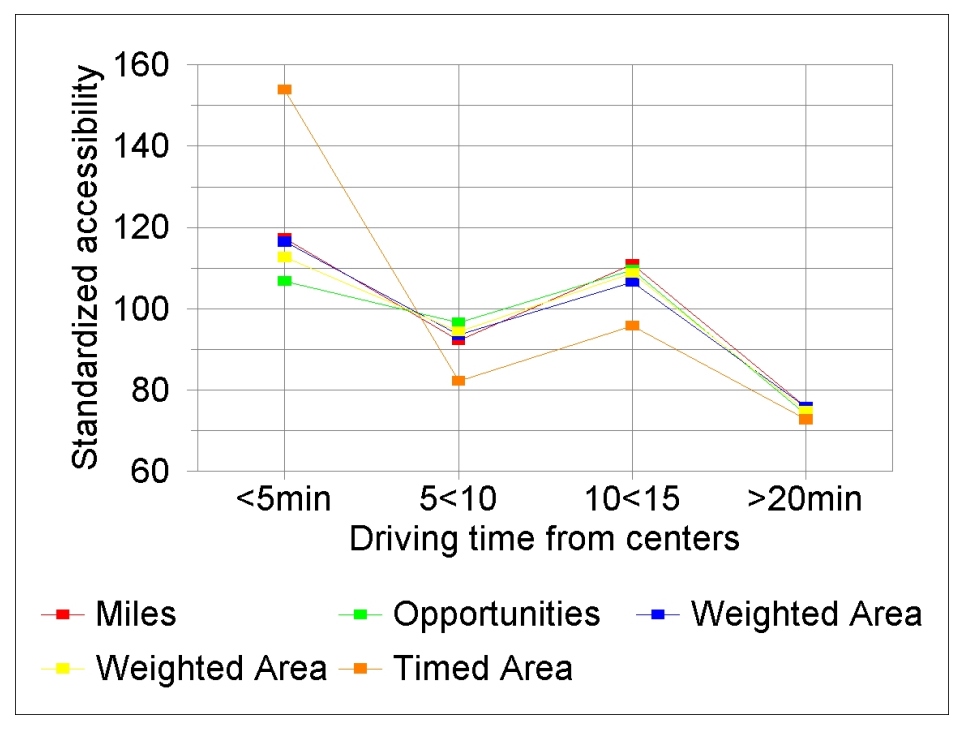
- Figure 6: Average individual accessibility by distance from
twelve regional centers in the Portland metro area.
- Figure 7: Average percent reduction in individual accessibility
by distance from twelve regional centers in the Portland metro area.
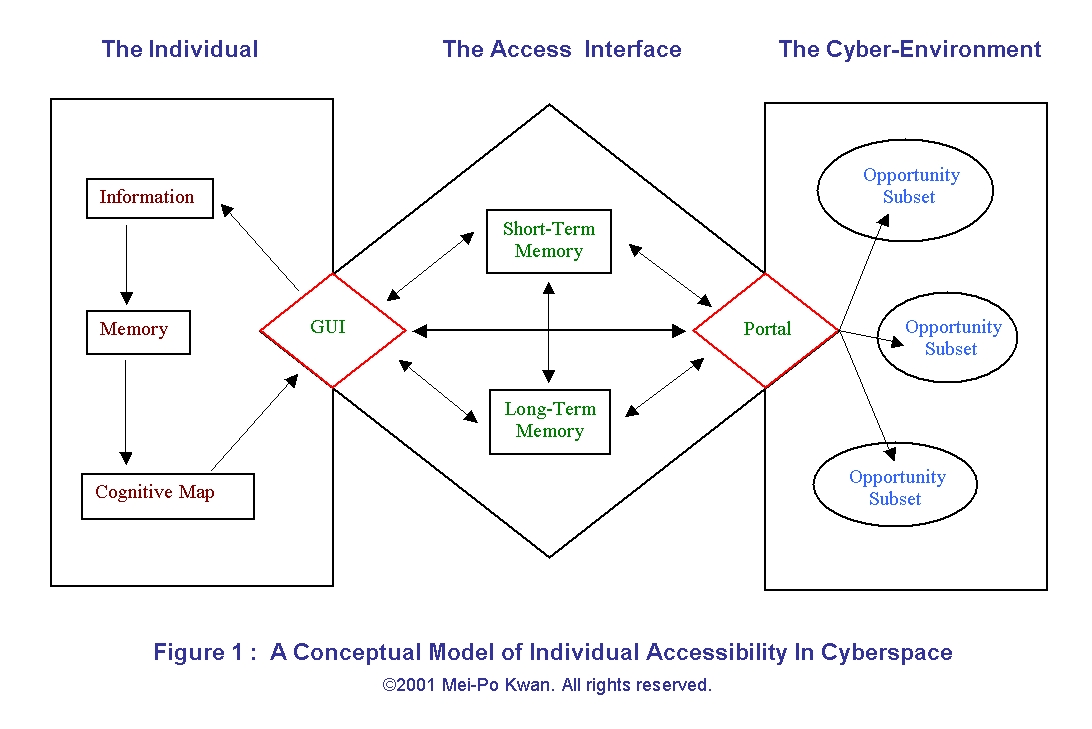
Mei-Po Kwan (2001) Cyberspatial Cognition and Individual Access to Information: The behavioral
Foundation of Cybergeography. Environment and Planning B, 28(1):21-37.
- Figure 1: A conceptual model of individual
accessibility in cyberspace.
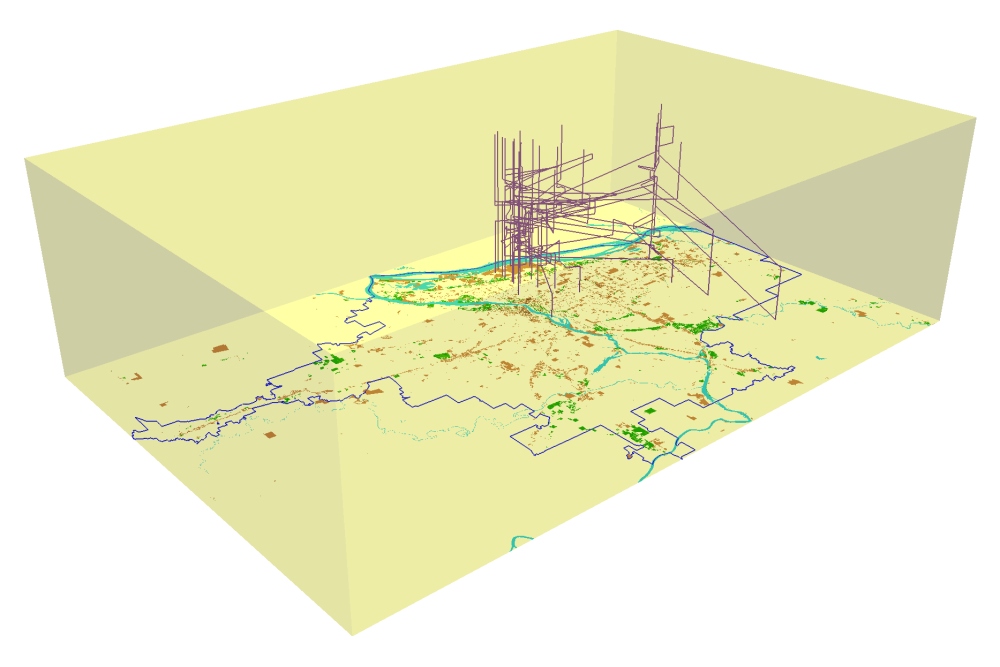
Mei-Po Kwan (2000) Interactive Geovisualization of Activity-Travel Patterns Using
Three-Dimensional Geographical Information Systems: A Methodological
Exploration with a Large Data Set. Transportation Research C, 8:185-203.
[Link Page]
- Figure 1: Simple activity patterns in space-time.
- Figure 2: Activity density patterns in geographic space.
- Figure 3: A close-up view of activity patterns in
geographic space.
- Figure 4a: Space-time activity density of non-employment activities
for women employed part-time.
- Figure 4b: Space-time activity density of non-employment activities
for men employed part-time.
- Figure 5: Gender difference in the density of non-employment activities
between women and men employed part-time.
- Figure 6: Space-time aquarium with the space-time paths of minority
groups in the subsample.
- Figure 7: A close-up view of downtown Portland from the 3D scene.
- Figure 8: Standardized space-time paths.
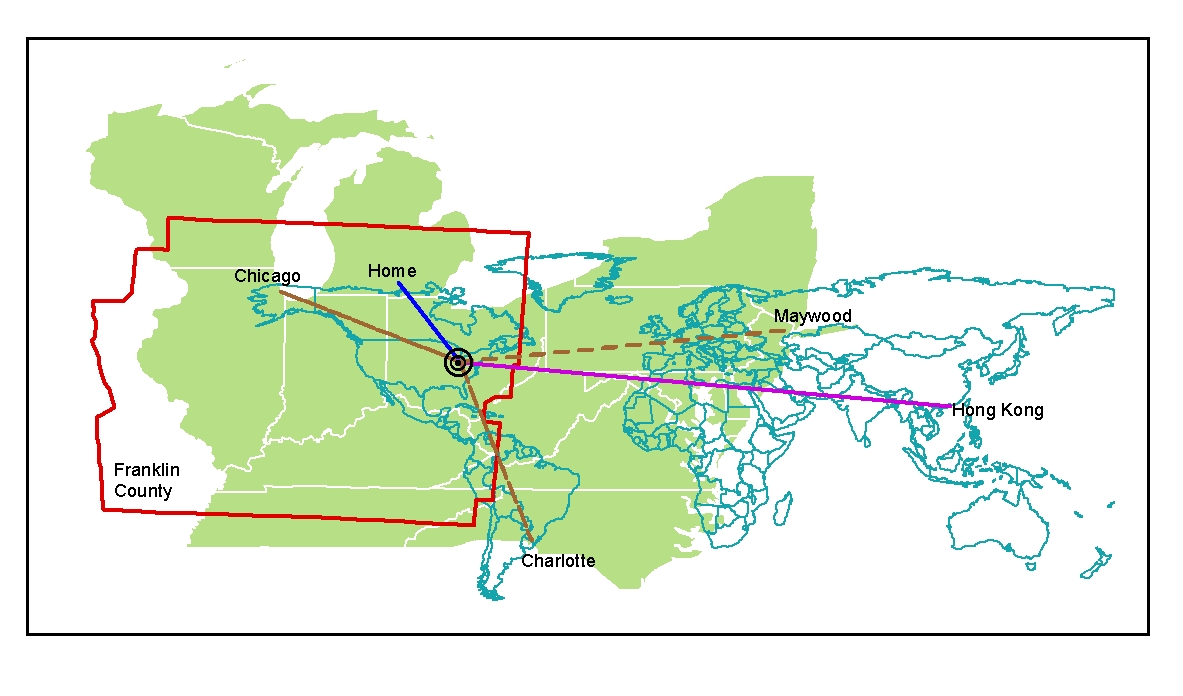
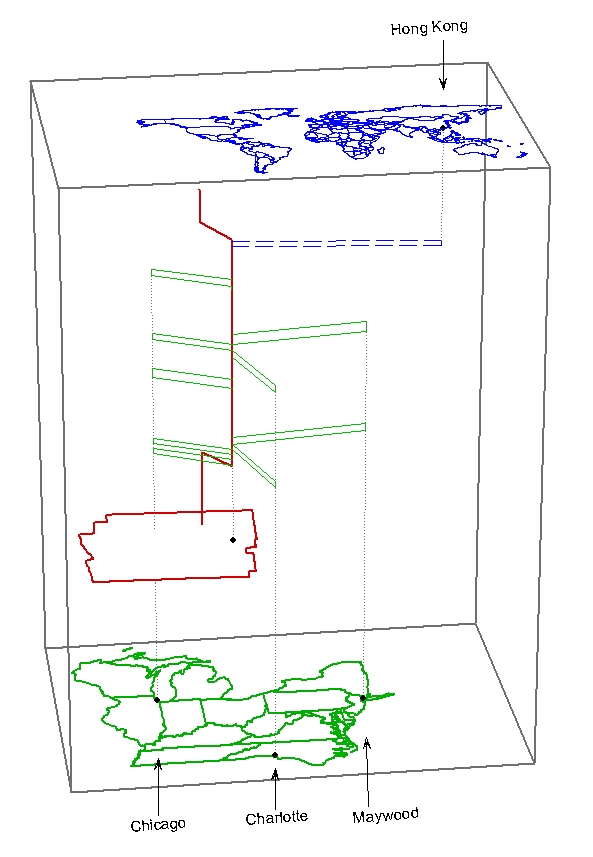
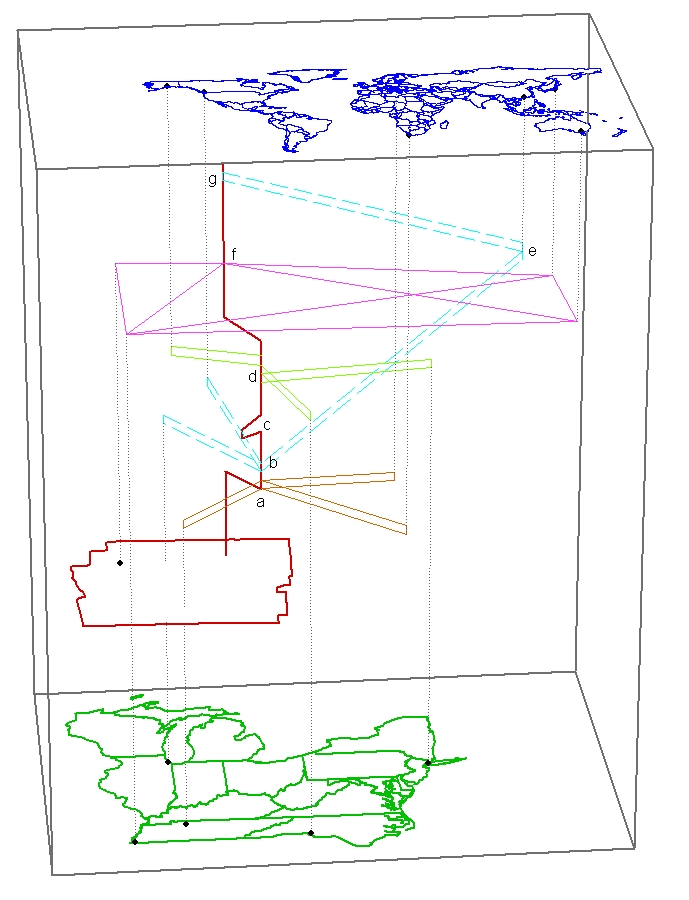
Mei-Po Kwan (2000) Human Extensibility and Individual Accessibility in Cyberspace:
A Multi-Scale Representation Using GIS. IN Donald Janelle and David Hodge, eds.,
Information, Place, and Cyberspace: Issues in Accessibility, Ch.14, 241-256. Berlin,
Springer-Verlag.
[Link Page]
- Figure 14.1: A two-dimensional representation of the
three map layers after transformation.
- Figure 14.2: A multi-scale, 3D representation of the
individual's space-time path.
- Figure 14.3: An extensibility diagram of a set of
hypothetical activities.
Mei-Po Kwan (2000) Evaluating Gender Differences in Individual Accessibility: A Study Using
Trip Data Collected by the Global Positioning System. Final Report to the Federal Highway
Administration.
[Link Page]
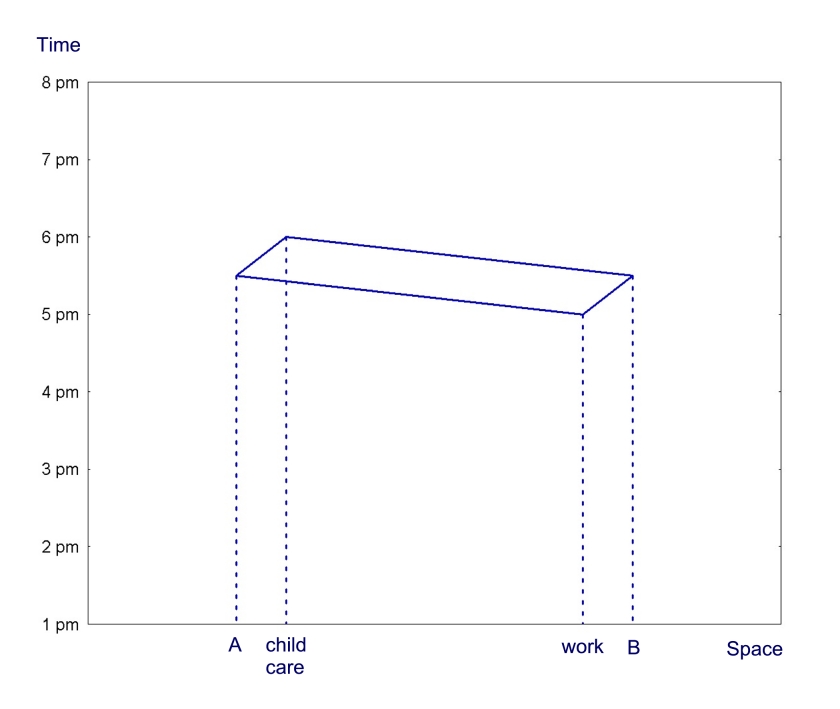
- Figure 1: Space-time prism and potential path
area (PPA). PPA in this case is
delimited by points A and B. (Adapted from Hanson [1995]).
- Figure 2: Location of urban opportunities in
exington metropolitan area.
- Figure 3: Space-time paths of women without
children under 16 in the household.
- Figure 4: Derivation of the daily potential path
area (DPPA). (Source: Kwan [1999a])
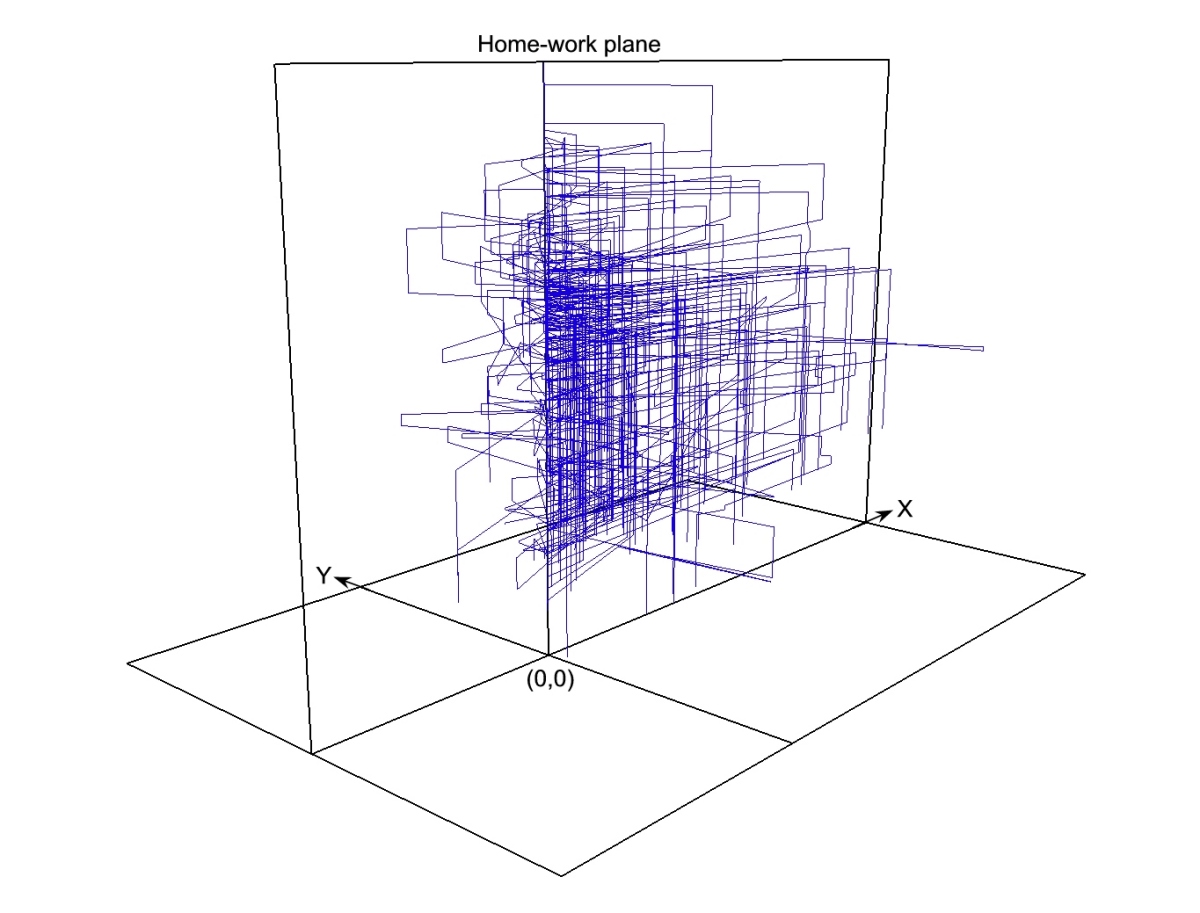
Mei-Po Kwan (1999) Gender, the Home-work Link, and Space-time Patterns of Non-employment
Activities. Economic Geography (1999) 75(4), 370-394.
[Link Page]
- Figure 1: Space-time aquarium for women employed full time.
- Figure 2: Space-time aquarium for women employed part time.
- Figure 3: Standardized space-time paths for women employed full time.
- Figure 4: Standardized space-time paths for men employed
full time.
- Figure 5: Space-time activity density surface of non-employment activities
for women employed full time.
- Figure 6: Space-time activity density surface of non-employment activities
for men employed full time.
- Figure 7: Standardized space-time paths for women employed part time.
- Figure 8: Space-time activity density surface of non-employment activities
for women employed part time.
Mei-Po Kwan (1999) Gender and Individual Access to Urban Opportunities: A Study
Using Space-Time Measures. The Professional Geographer, 51(2):210-227.
[Link Page]
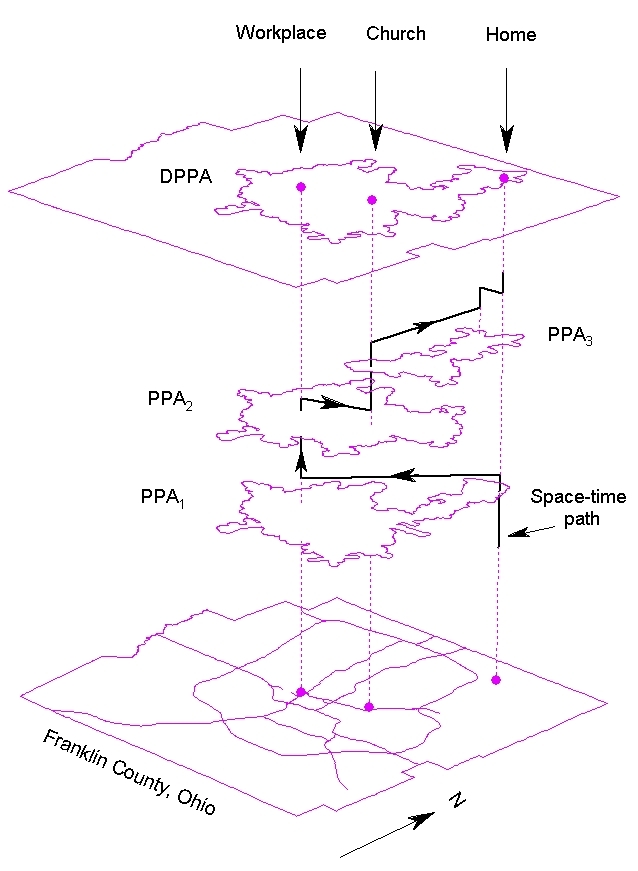
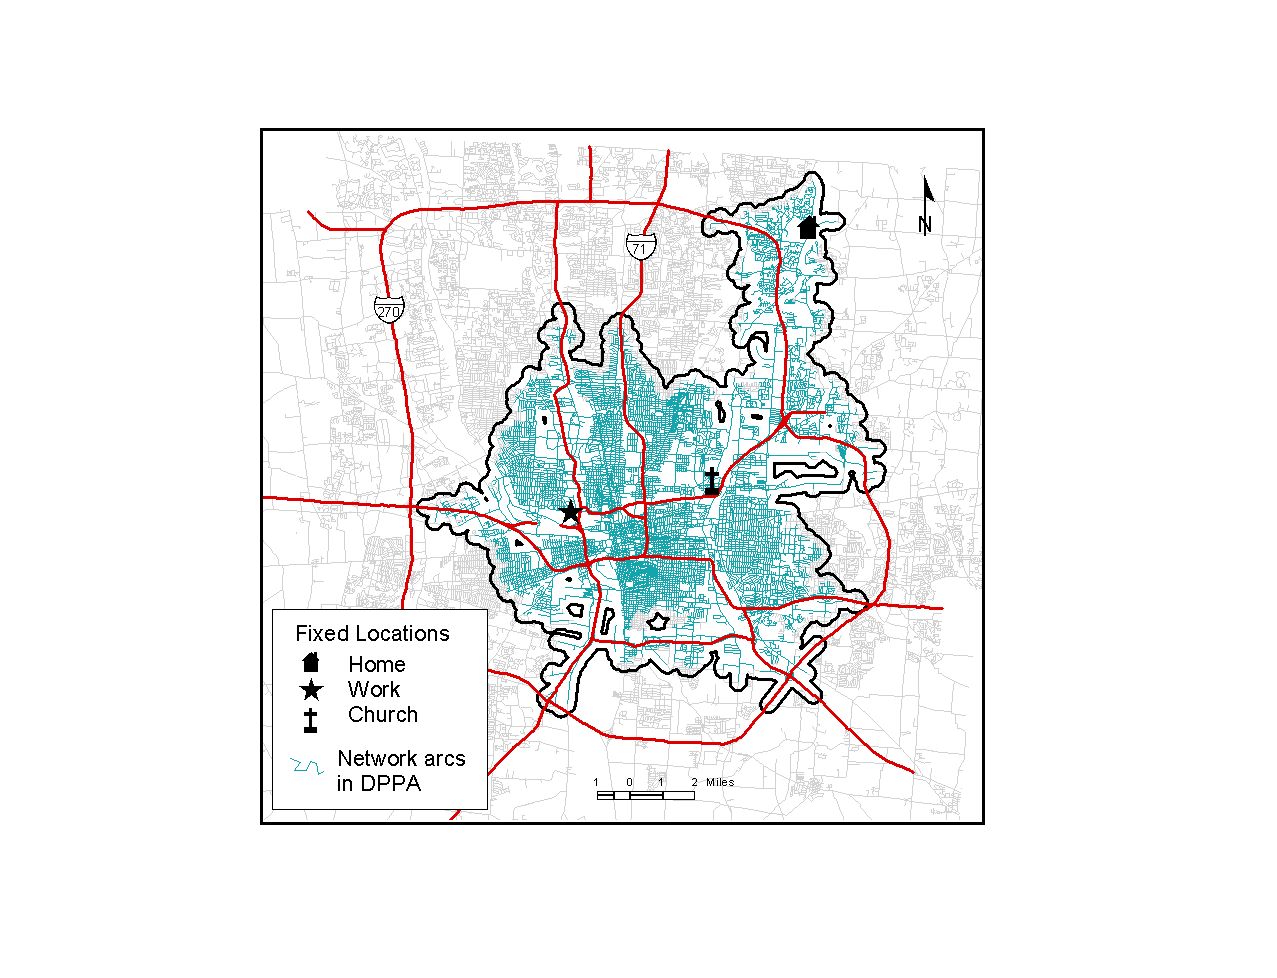
- Figure 1: Derivation of the daily potential path
area (DPPA).
- Figure 2: A two-dimensional representation of the
daily potential path area (DPPA) of the individual.
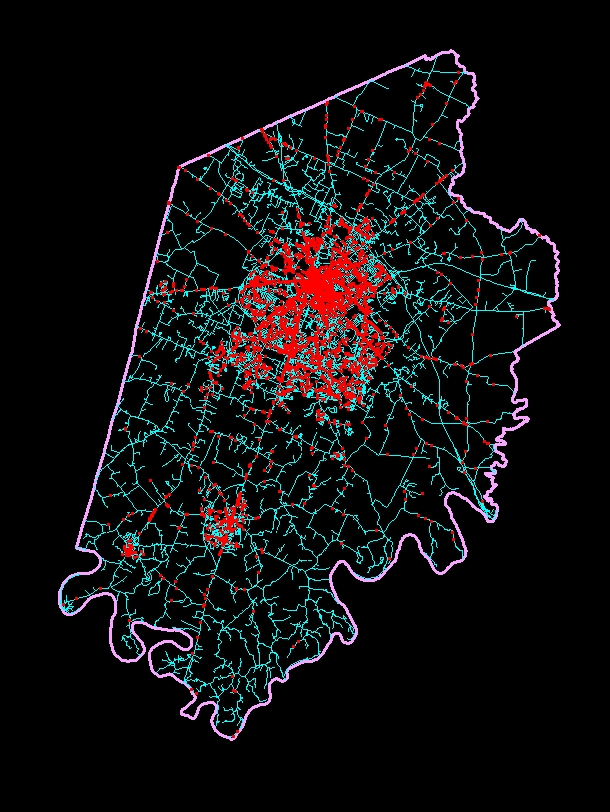
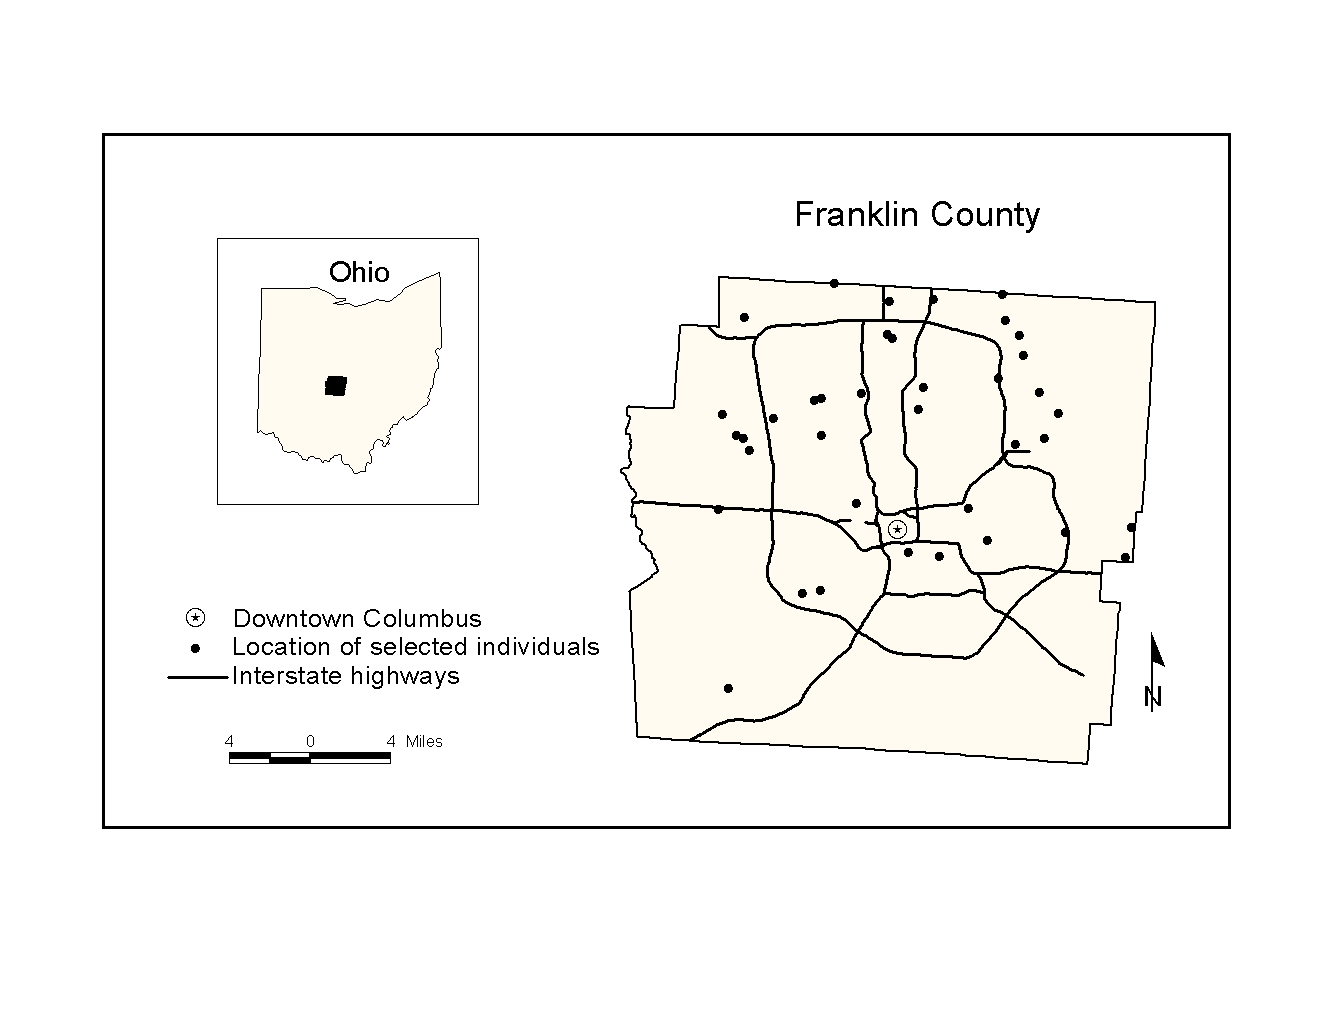
- Figure 3: The study area and home locations of the
individuals in the subsample.
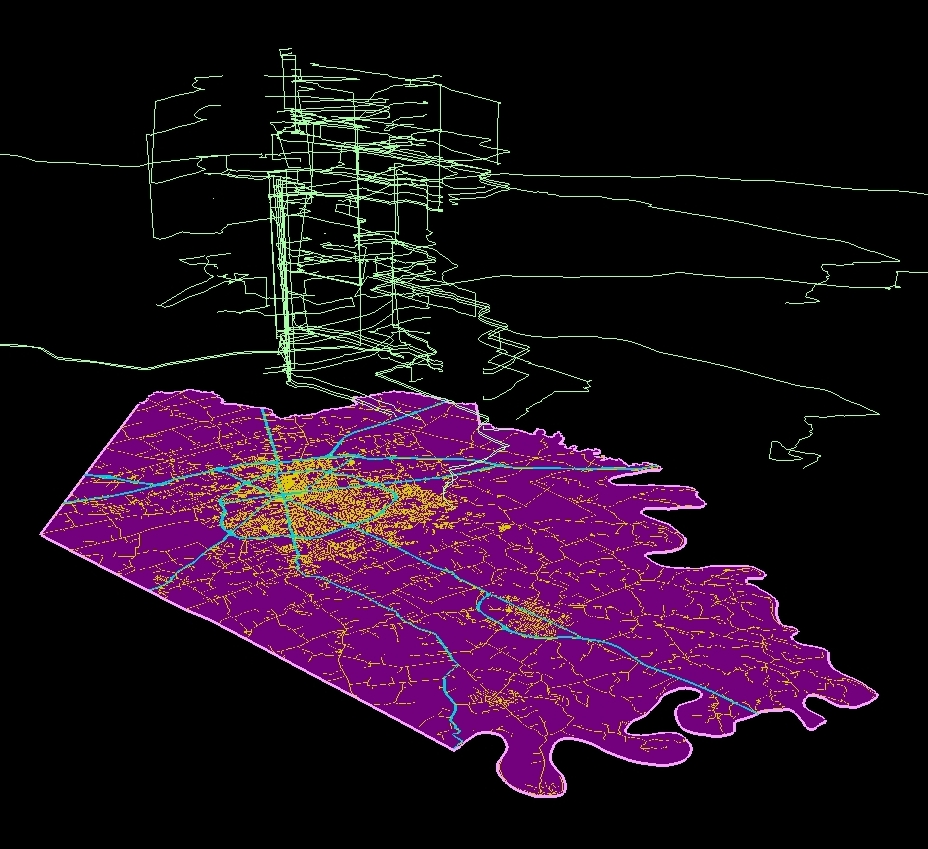
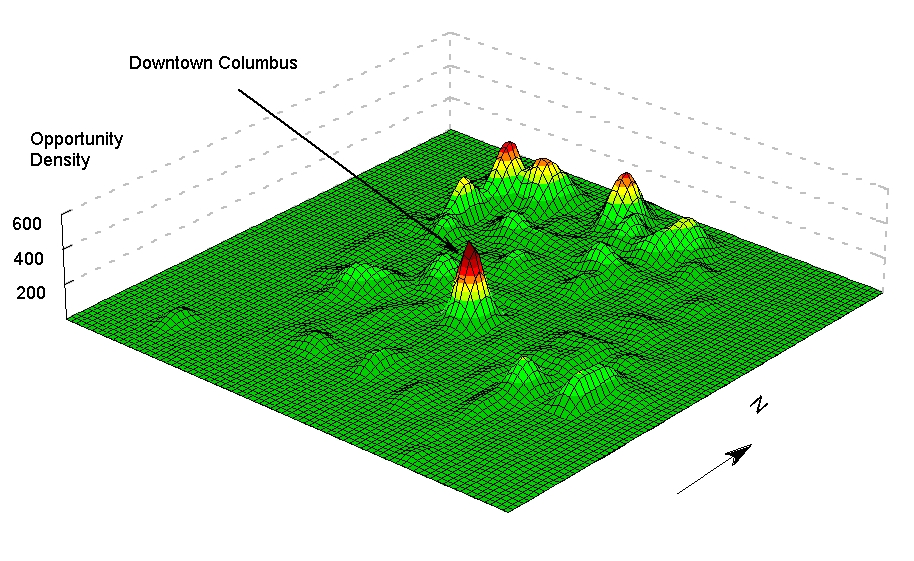
- Figure 4: Density surface of urban opportunities in
Franklin County, Ohio.
Mei-Po Kwan (1998) Space-time and Integral Measures of Individual Accessibility: A Comparative
Analysis Using a Point-Based Framework. Geographical Analysis (1998) 30(3), 191-216.
[Link Page]
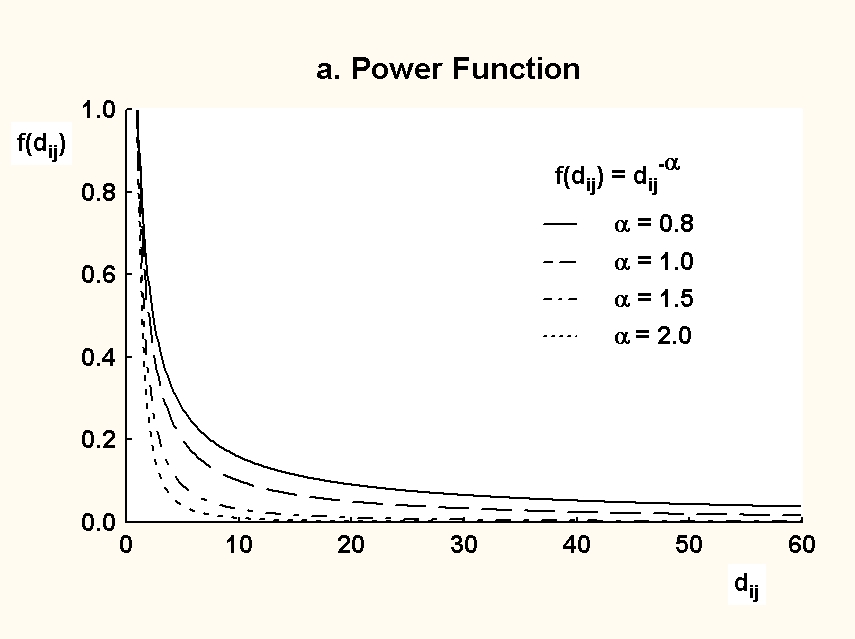
- Figure 1a: Impedance functions for the gravity-type
accessibility measures: Power function.
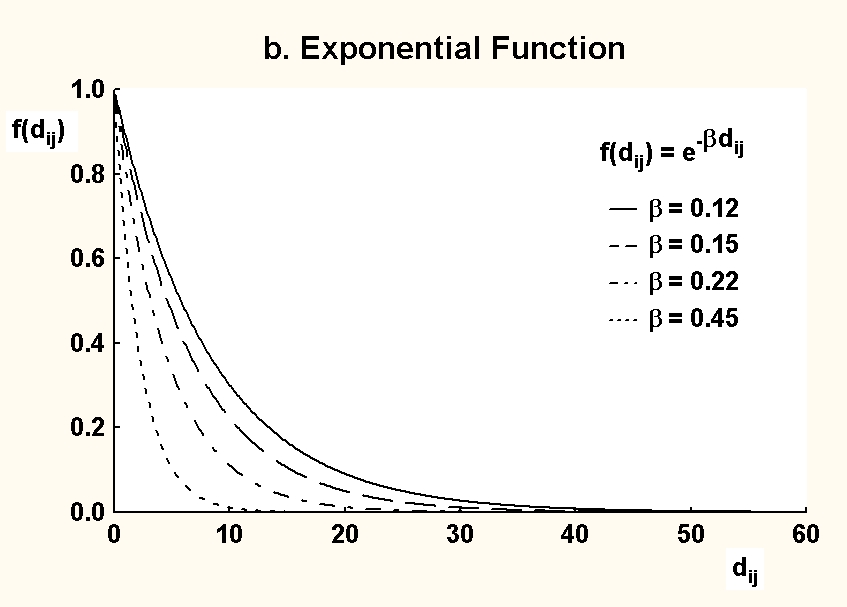
- Figure 1b: Impedance functions for the gravity-type
accessibility measures: Exponential function
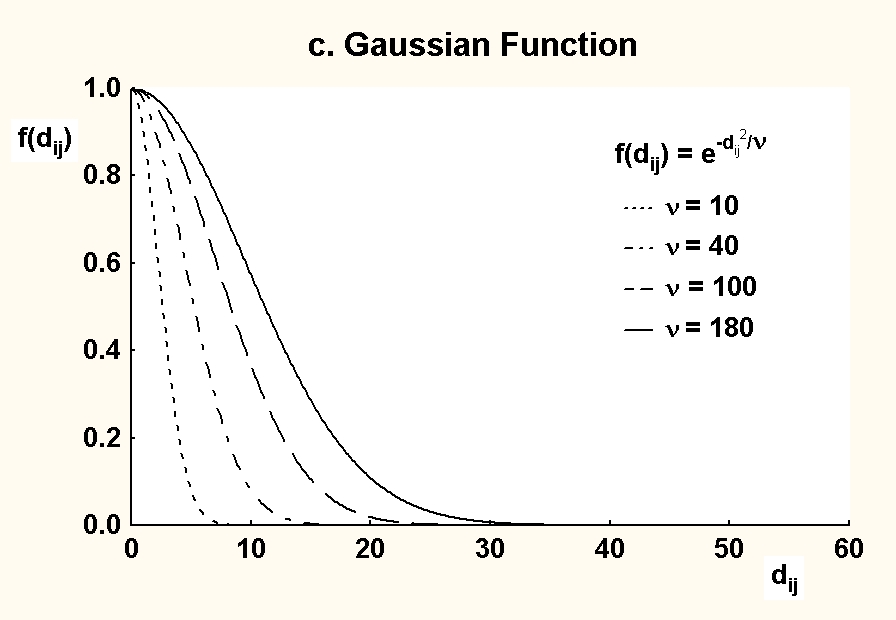
- Figure 1c: Impedance functions for the gravity-type
accessibility measures: Gaussian function.
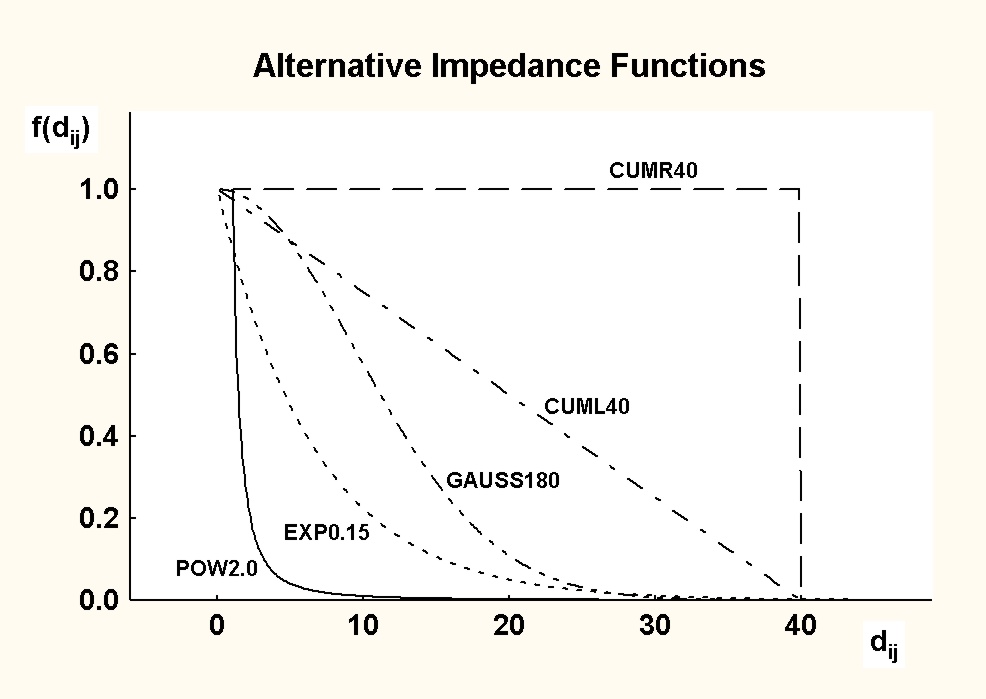
- Figure 1d: Various impedance functions compared.
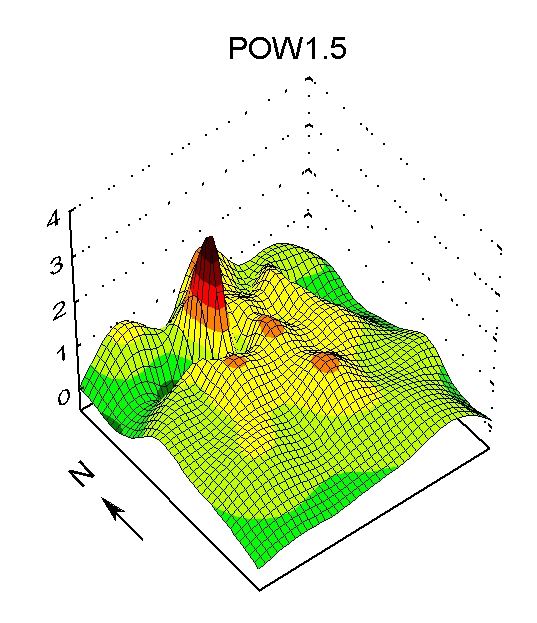
- Figure 2a: Accessibility surface of the gravity-type
measure: POW 1.5.
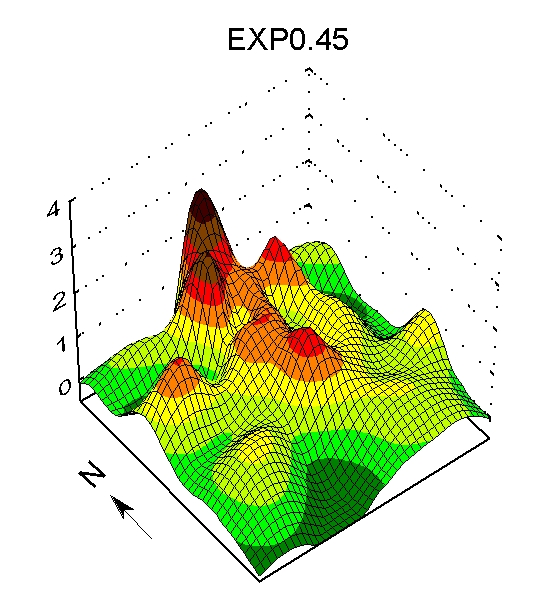
- Figure 2b: Accessibility surface of the gravity-type
measure: EXP 0.45.
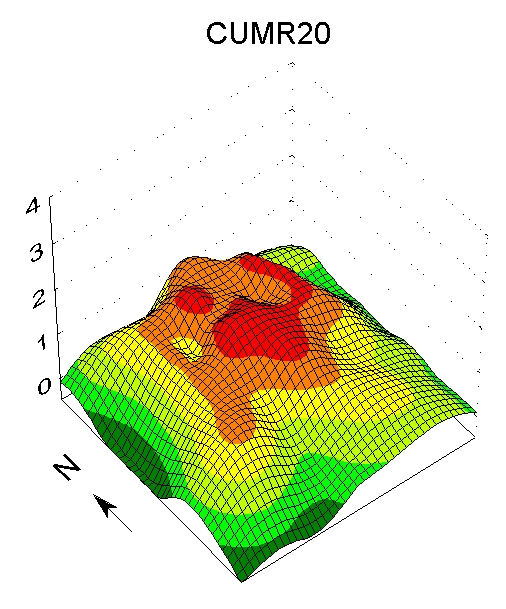
- Figure 3a: Accessibility surface of the
cumulative-opportunity measure: CUMR 20.
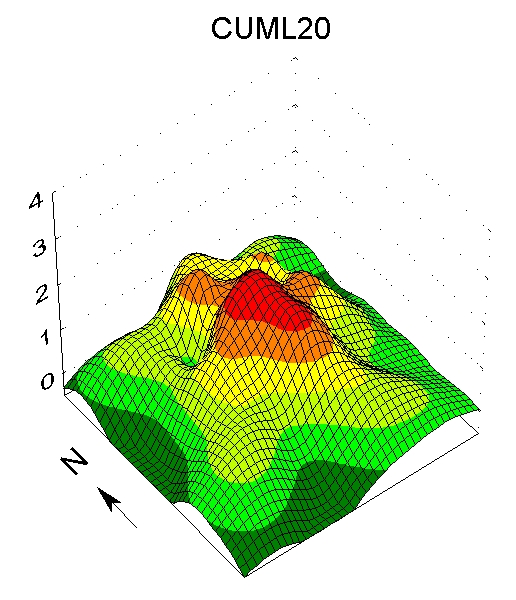
- Figure 3b: Accessibility surface of the
cumulative-opportunity measure: CUML 20.
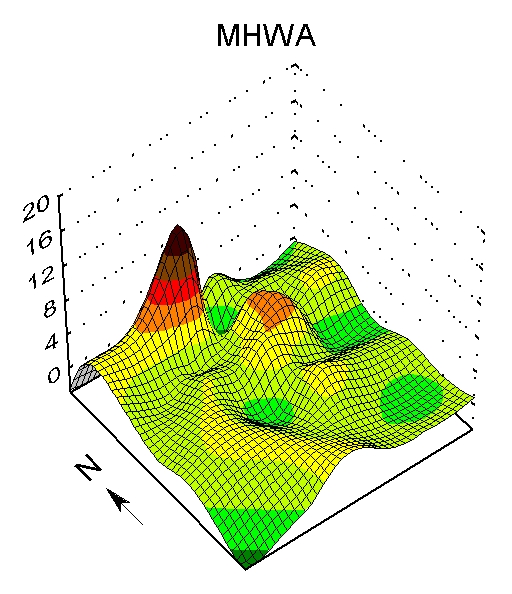
- Figure 4a: Accessibility surface of the space-time
measure: MHWA.
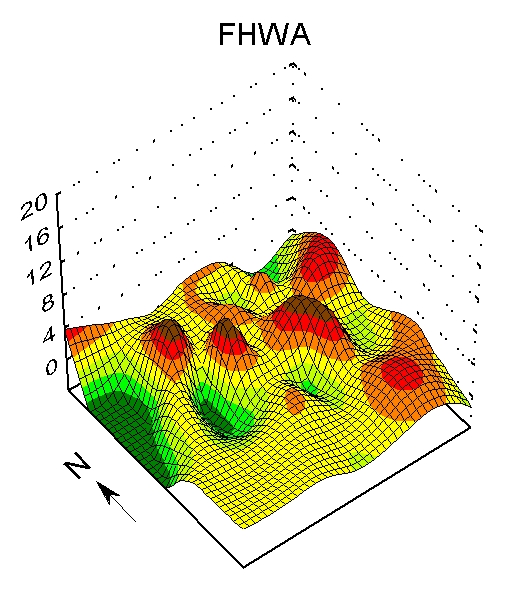
- Figure 4b: Accessibility surface of the space-time
measure: FHWA.
Kwan's Homepage
© 1998-2014 Mei-Po Kwan. All rights reserved.
Last Updated on January 2, 2014.
|