|
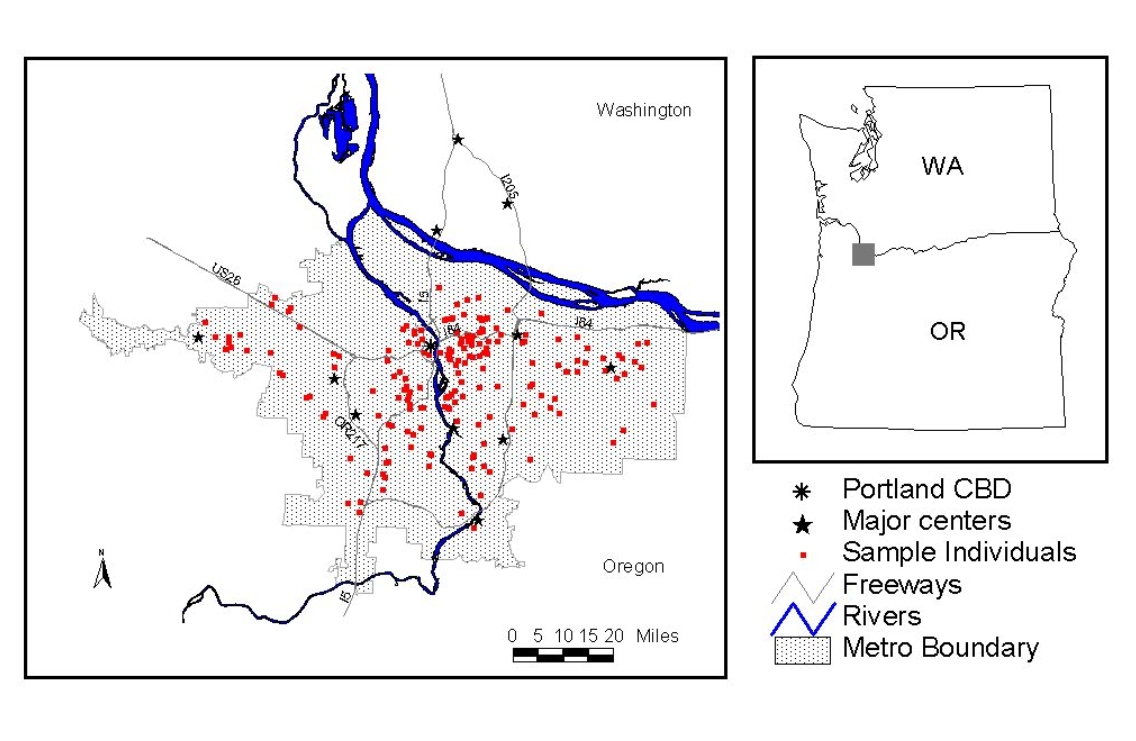
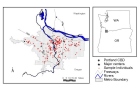
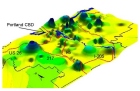
Figure 1: Portland, Oregon, study area.
|
|
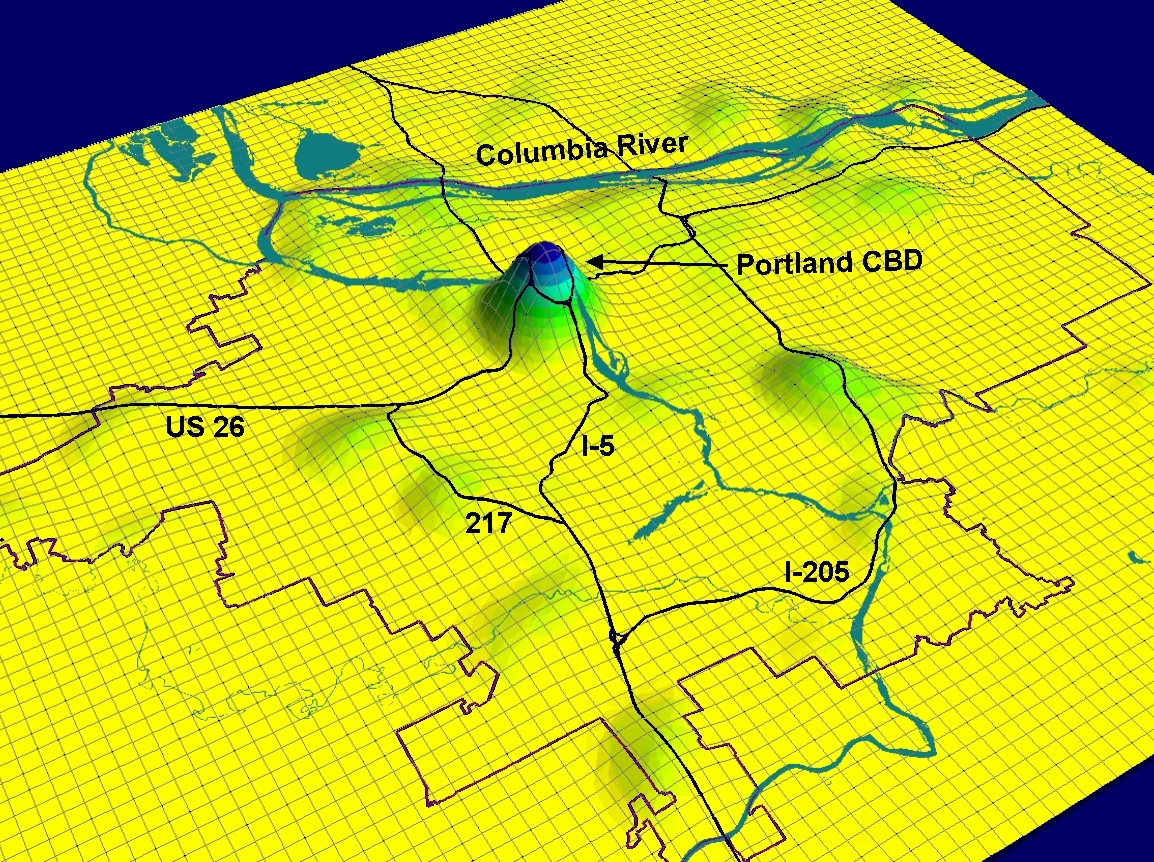
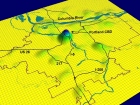
Figure 2: Weighted opportunity density surface of Portland study area.
|
|
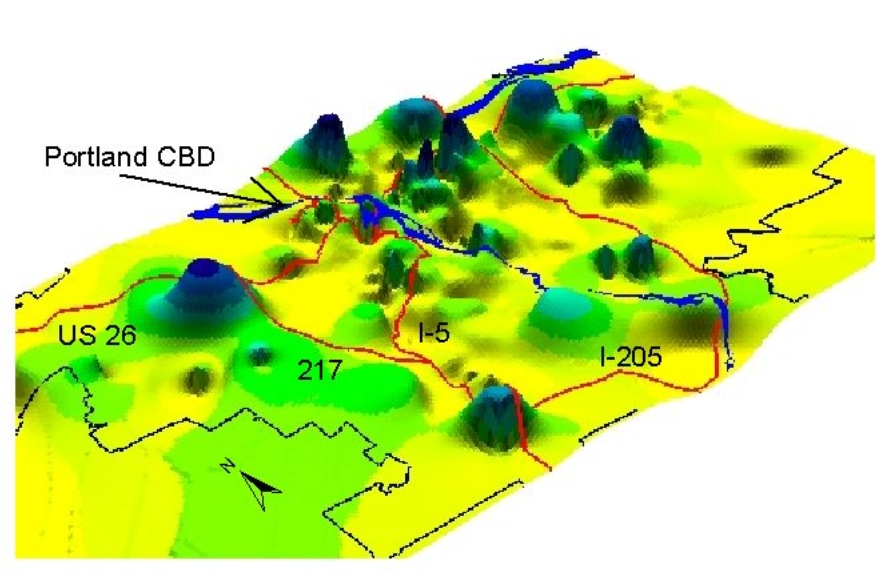
Figure 3: Weighted opportunity individual accessibility surface for Portland study area.
|
|
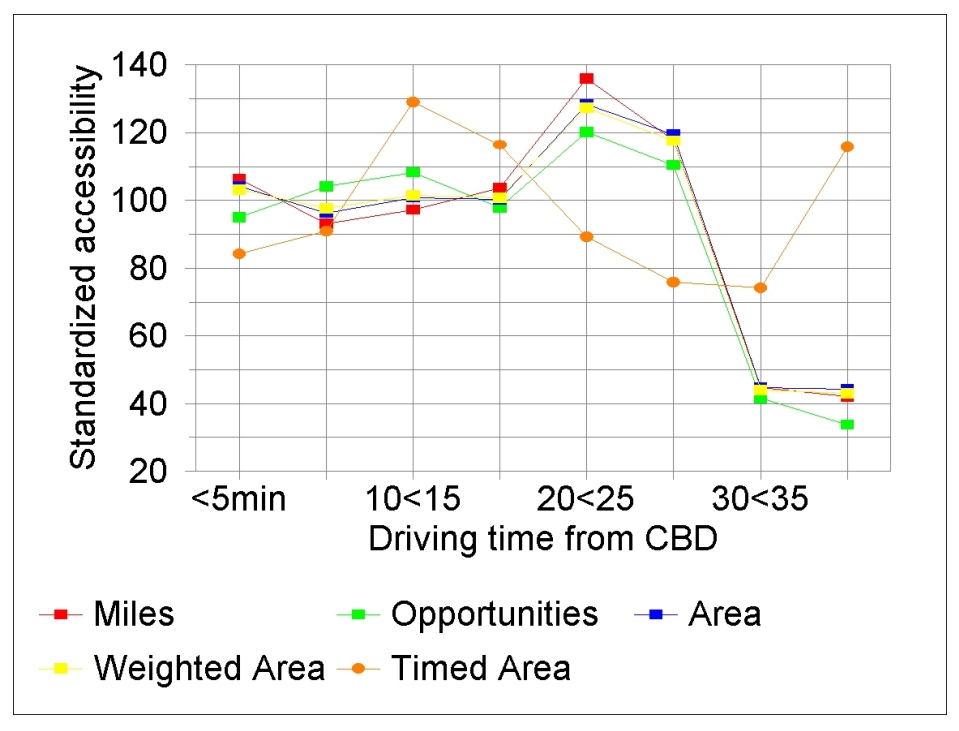
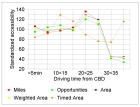
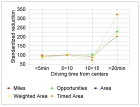
Figure 4: Average individual accessibility by distance from the Portland Central Business
District (CBD).
|
|
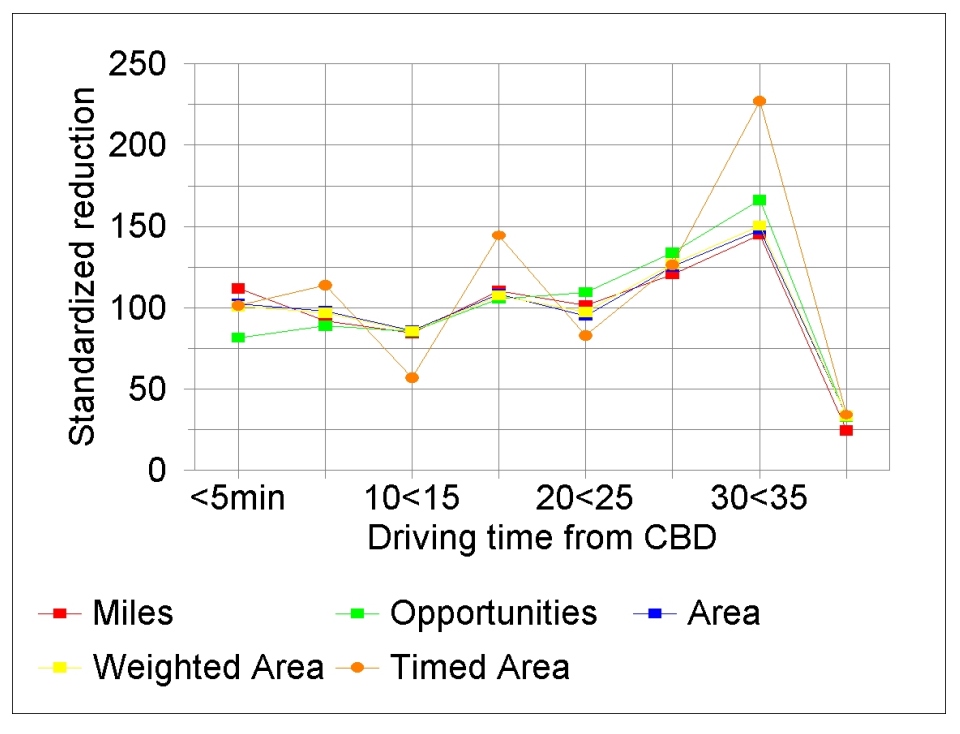
Figure 5: Average percent reduction in individual accessibility by distance from the
Portland Central Business District (CBD).
|
|
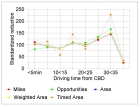
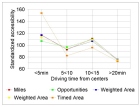
Figure 6: Average individual accessibility by distance from twelve regional centers
in the Portland metro area.
|
|
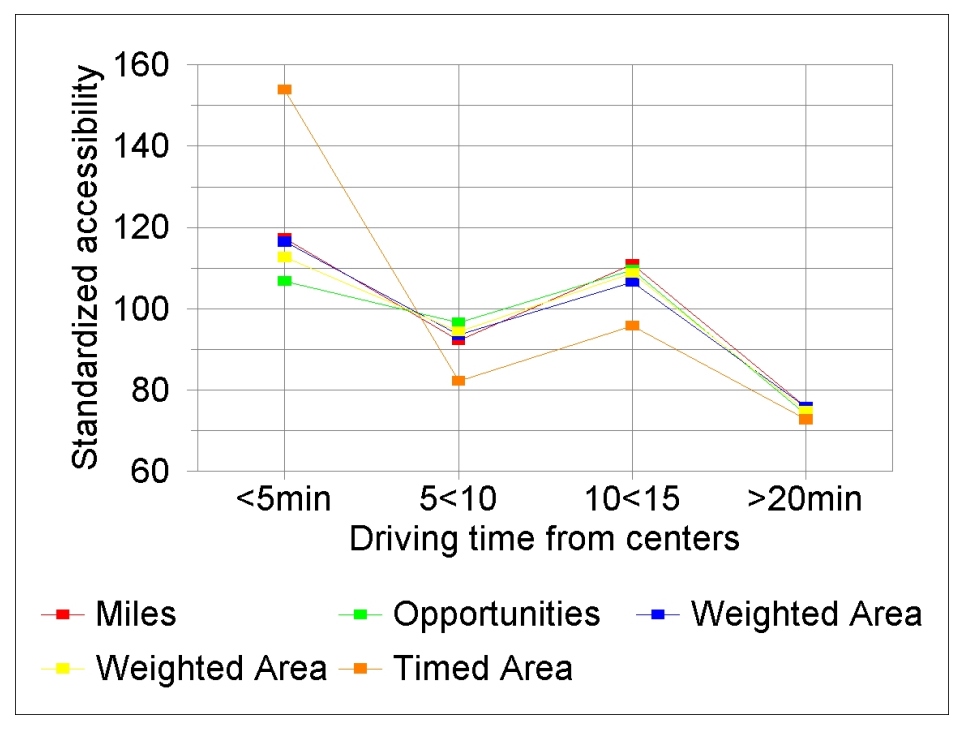
Figure 7: Average percent reduction in individual accessibility by distance from
twelve regional centers in the Portland metro area.
|