|
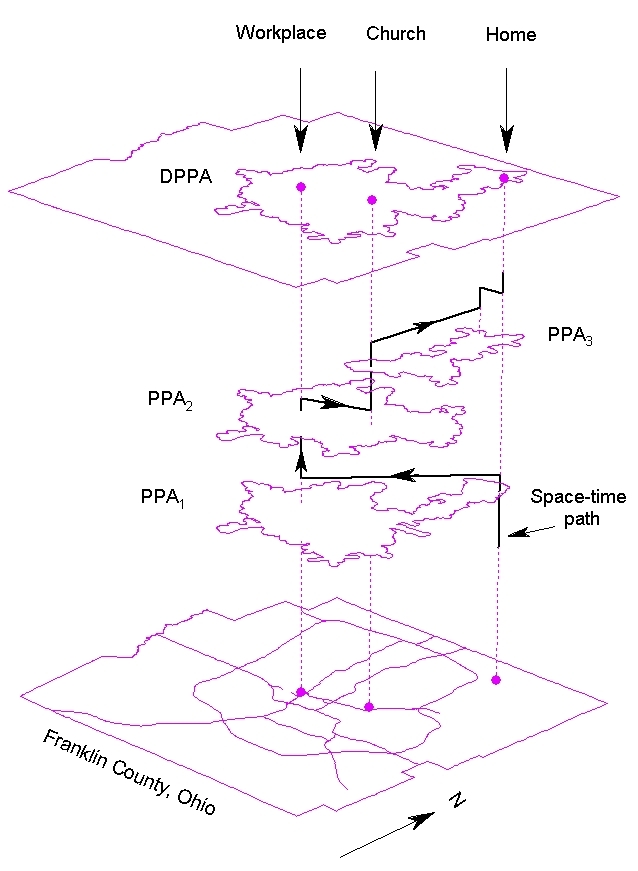
Figure 1: Derivation of the daily potential path area (DPPA). |
|
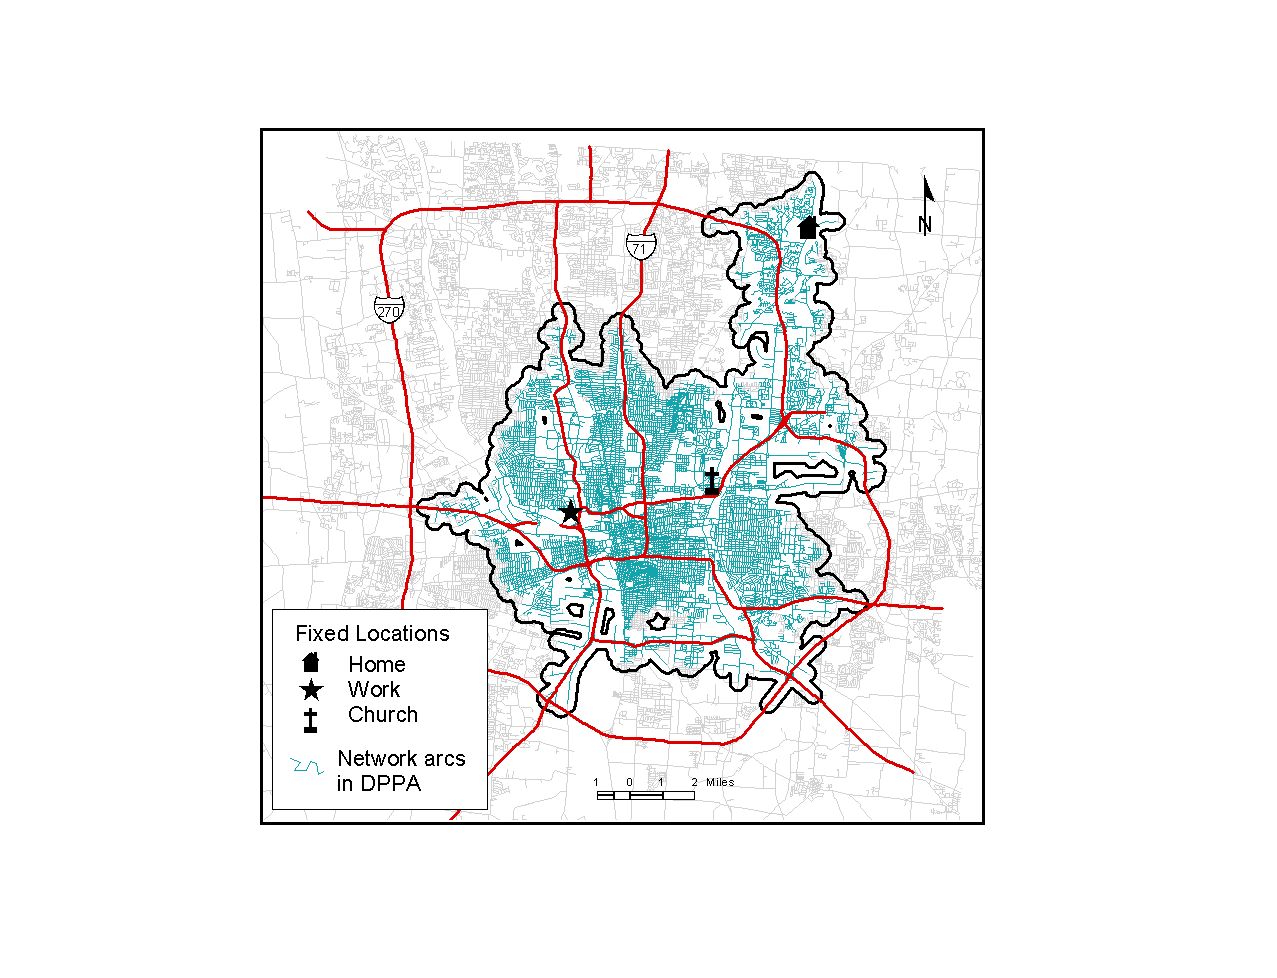
Figure 2: A two-dimensional representation of the daily potential path area (DPPA) of the individual. |
|
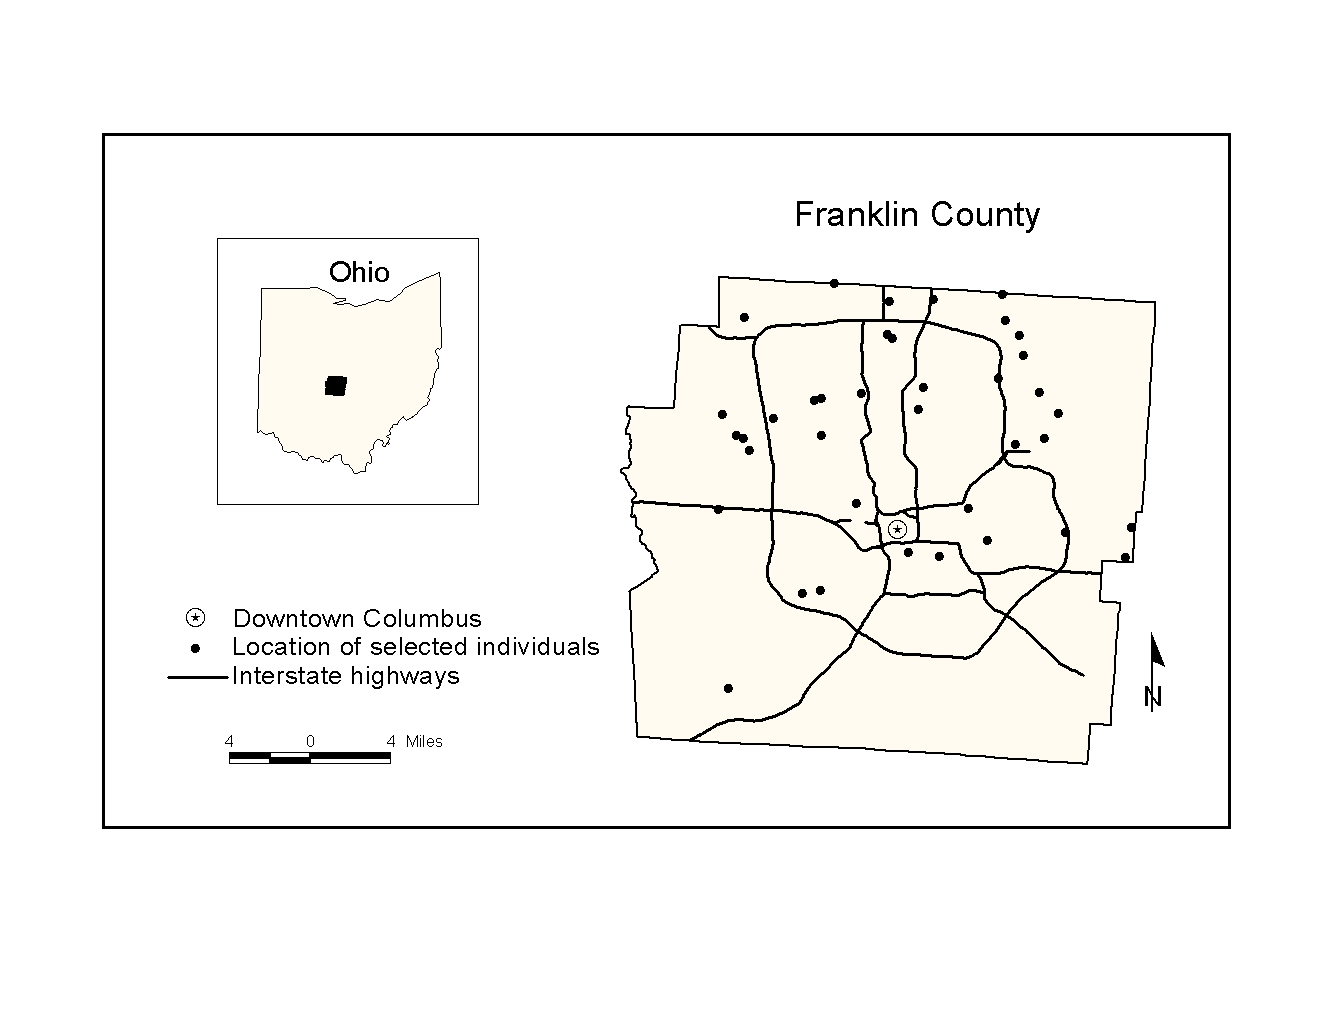
Figure 3: The study area and home locations of the individuals in the subsample. |
|
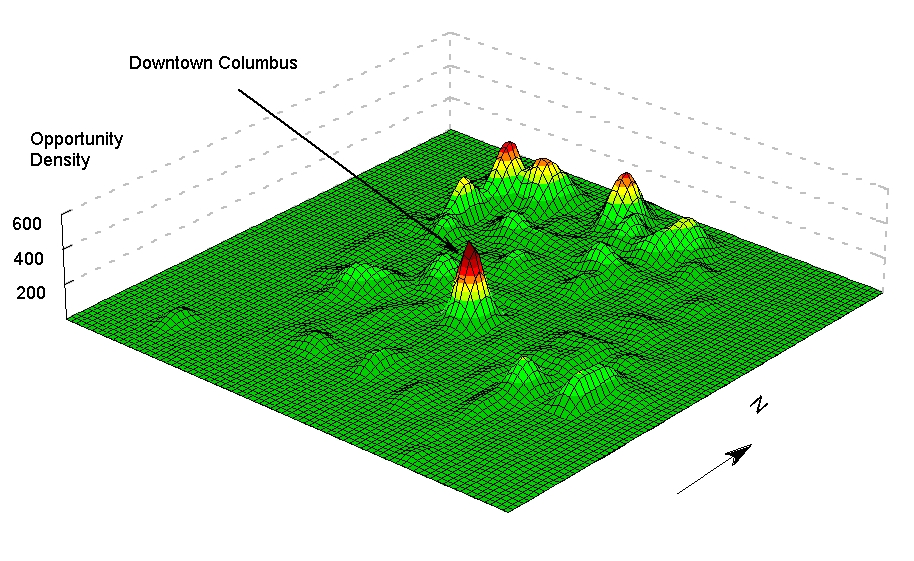
Figure 4: Density surface of urban opportunities in Franklin County, Ohio. |