|
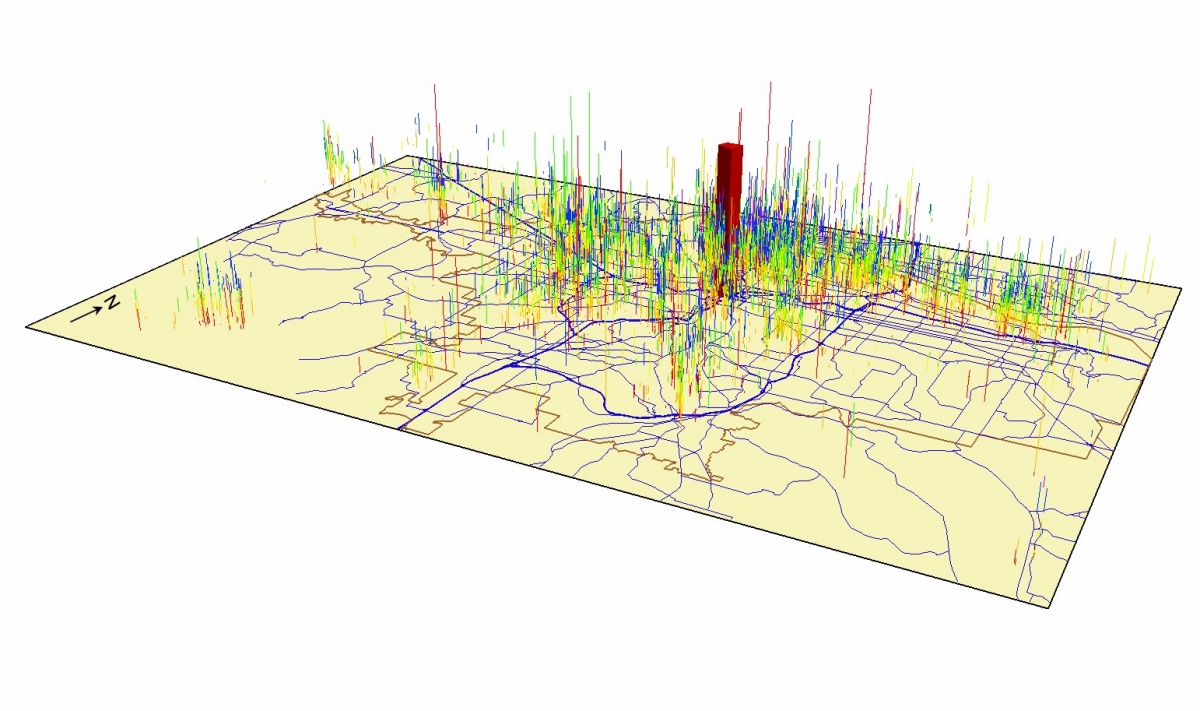
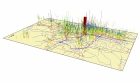
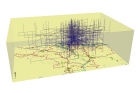
Figure 1: Simple activity patterns in space-time. (295K)
|

|
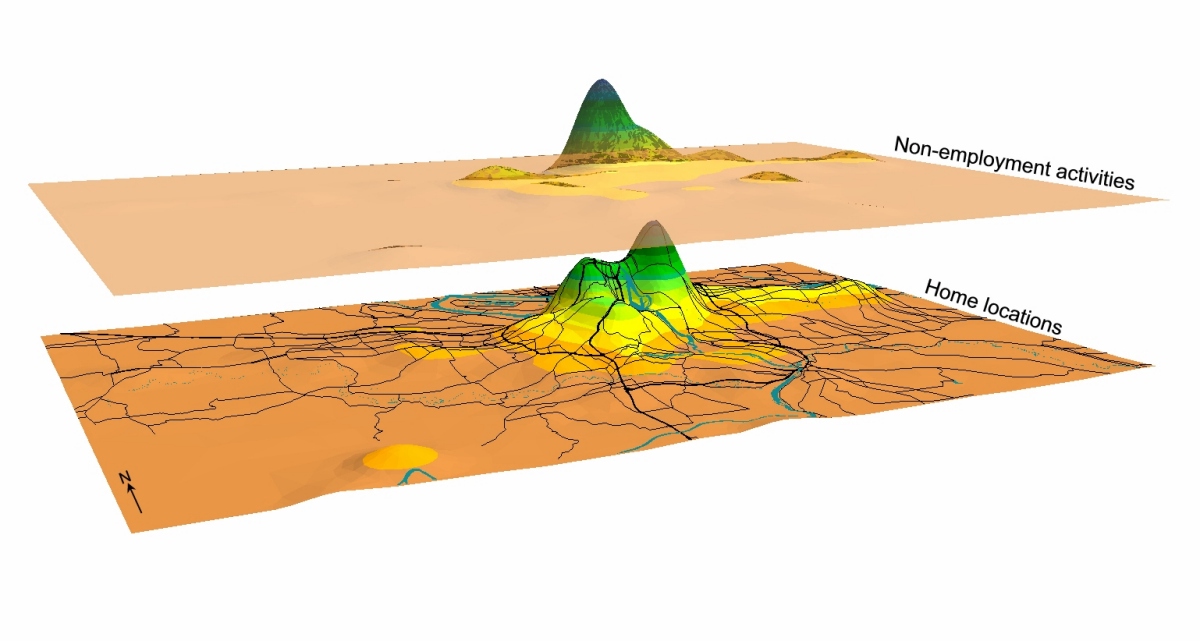
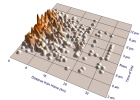
Figure 2: Activity density patterns in geographic space. (186K)
|

|
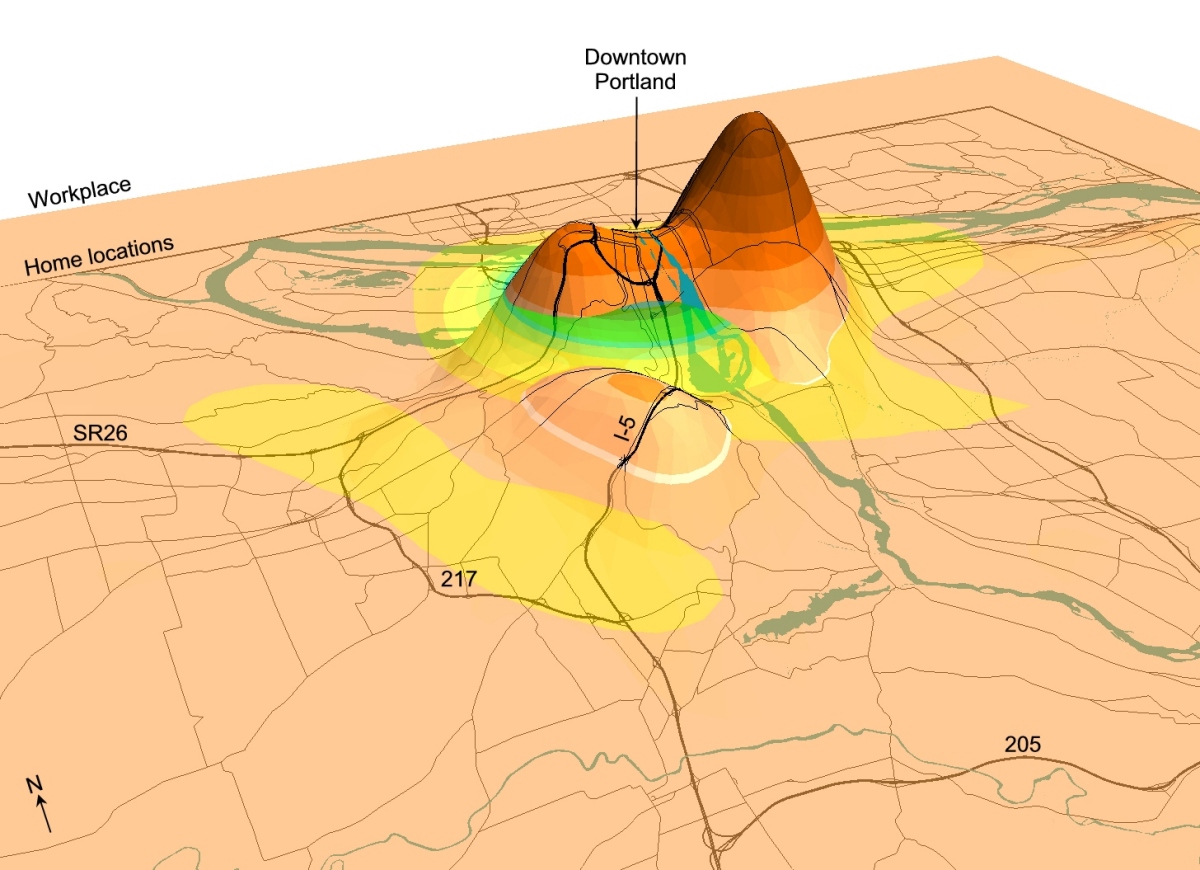
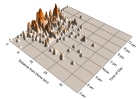
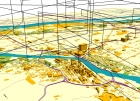
Figure 3: A close-up view of activity patterns in geographic space. (328K)
|
|
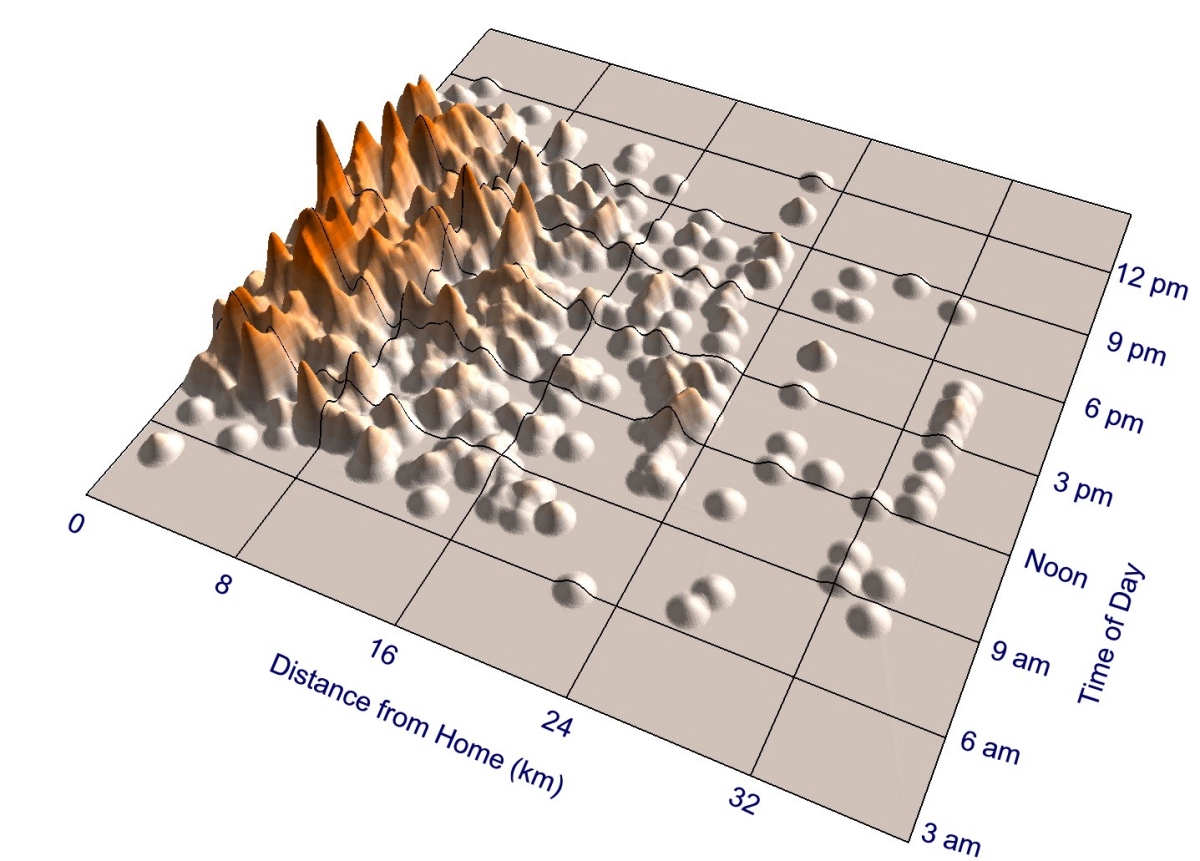
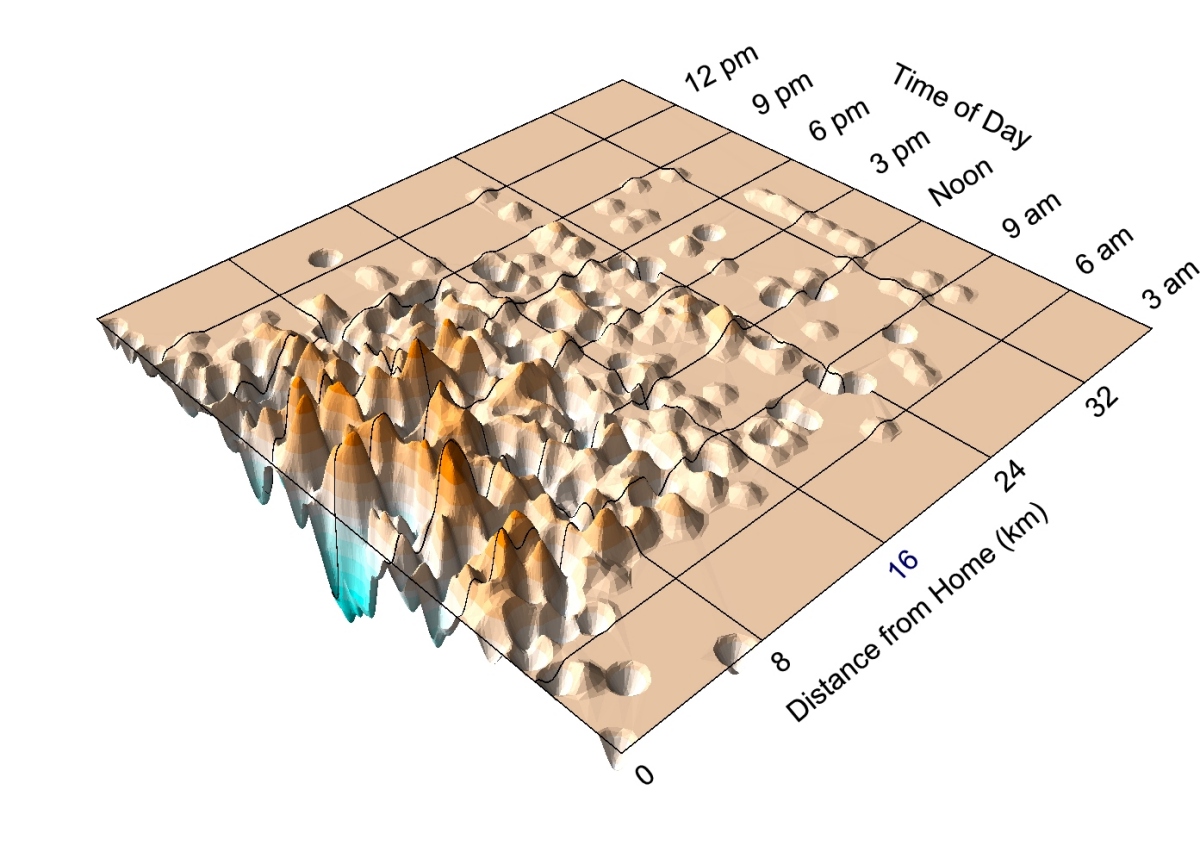
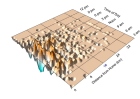
Figure 4: Space-time activity density of non-employment activities for women employed part-time.
(304K)
|
|
Figure 4b: Space-time activity density of non-employment activities for men employed part-time.
(248K)
|
|
Figure 5: Gender difference in the density of non-employment activities between women
and men employed part-time. (293K)
|
|
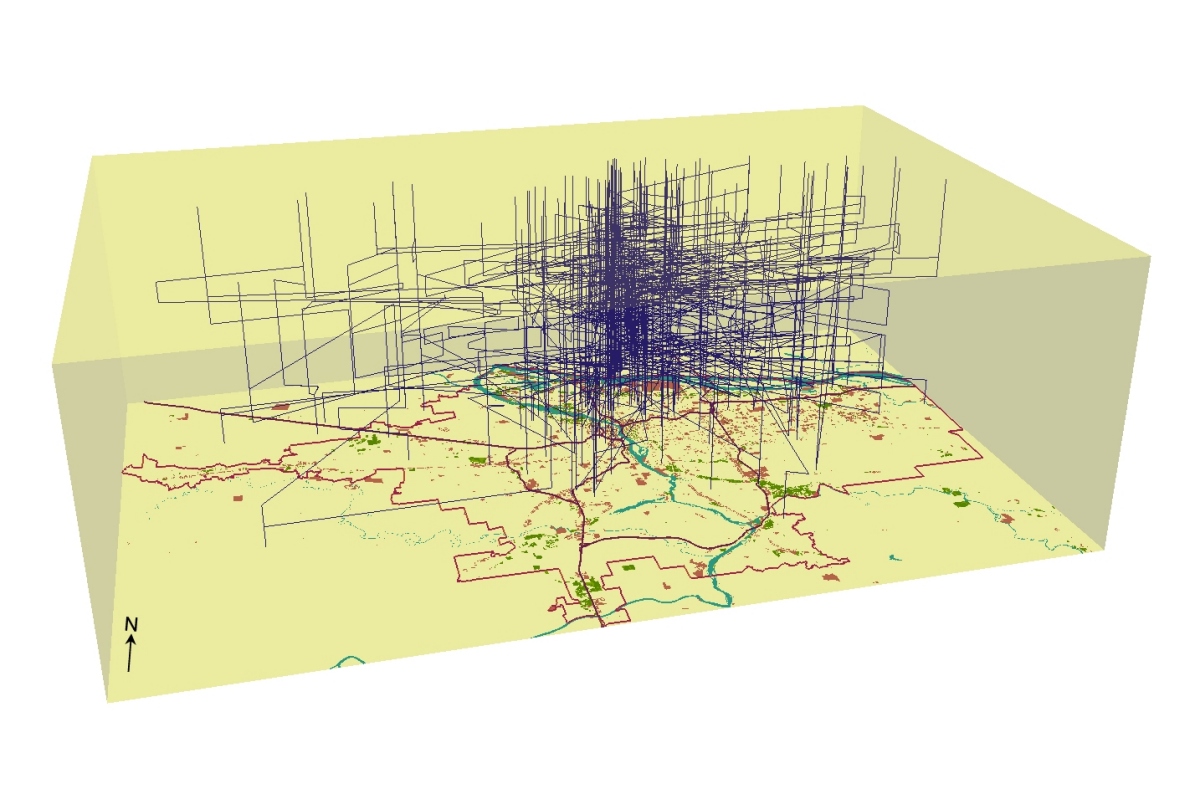
Figure 6: Space-time aquarium with the space-time paths of minority groups in the subsample.
(278K)
|
|
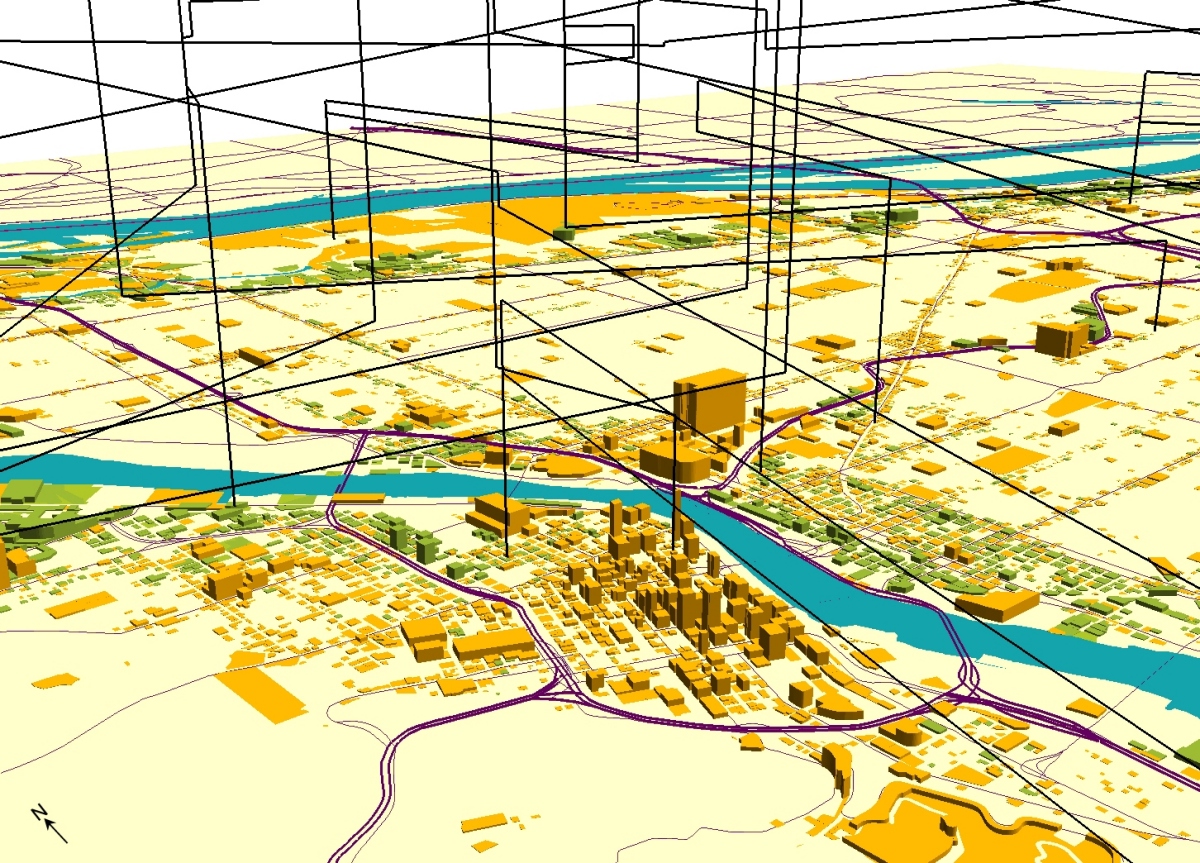
Figure 7: A close-up view of downtown Portland from the 3D scene. (746K)
|
|
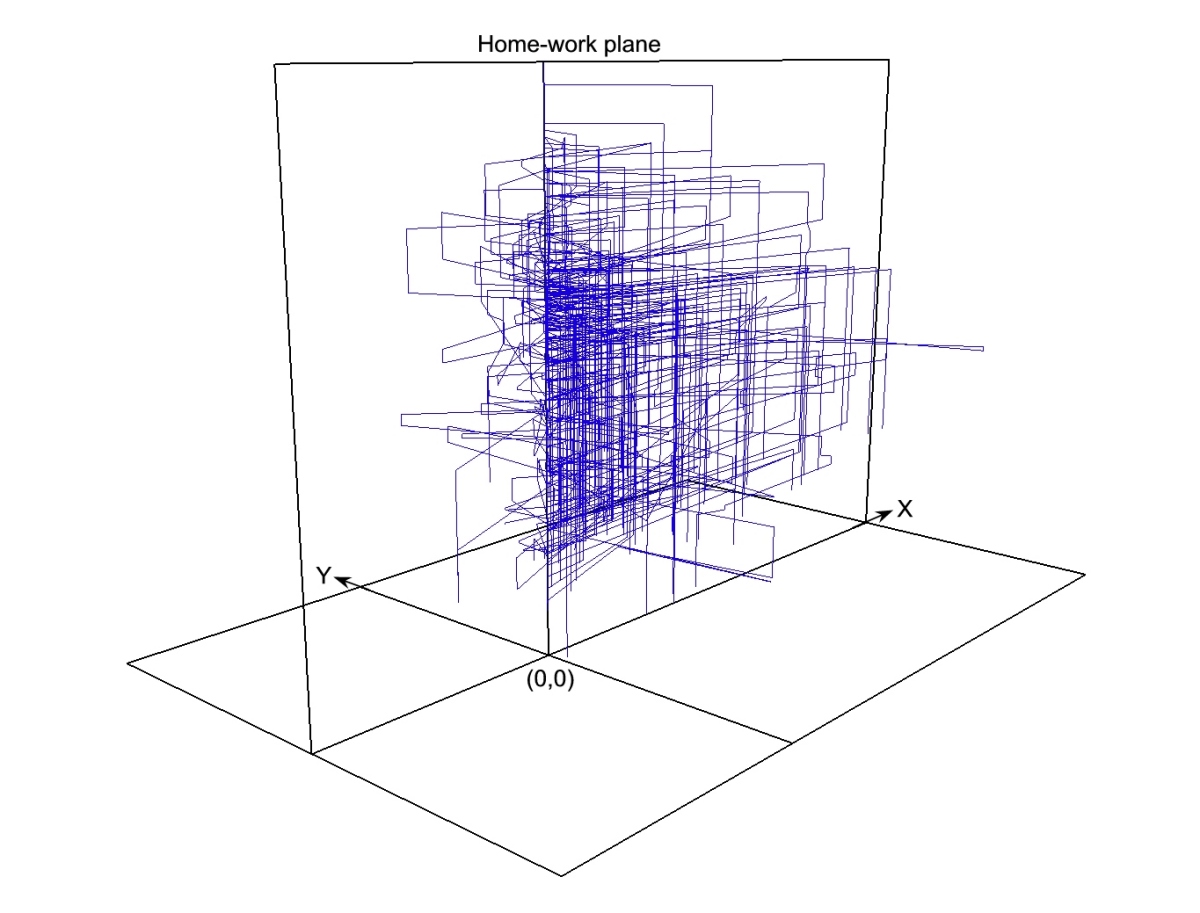
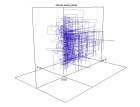
Figure 8: Standardized space-time paths. (234K)
|